If you follow the financial news media, you will frequently hear of countries’ largest trade partners being either the United States, the European Union, or China. As a result, it can often seem like the US, EU, and China are at the centre of massive global networks of international trade. In a certain sense, of course, they are: the combined external merchandise trade of the US, EU, and China is equal to an estimated 11 trillion dollars a year. And yet, relative to the enormous size of their GDPs, the US, EU, and to a lesser degree China do not actually trade very much compared to most other countries.
North America and Europe are in fact relatively insular in their international commercial relations. The US and the EU, for instance, trade an amount of goods estimated at around 25 percent of their GDPs; by comparison, Germany trades an amount equal to an estimated 70 percent of its GDP, South Korea trades an amount equal to roughly 80 percent of its GDP, and the Netherlands trades an amount equal to roughly 150 percent of its GDP. Even China, which is generally viewed as a highly trade-dependent economy, trades an amount that is equal to only an estimated 45 percent of its GDP, which is lower than most of the countries in the world.
In other words, the economies of the US, EU, and China only seem so trade-oriented because their massive economic size makes them the largest trade partners of a large majority of the world’s countries. This confusion stems from the fact that the media tends to view the size of international trade values in absolute terms only, rather than by looking at the size of those trade values relative to some other relevant factor, such as the size of the GDP’s of the countries involved in the trade. By looking only at absolute trade values, the huge economies of the US, EU, and China end up getting almost all of the public attention, even though their “relative” trade with most other countries actually tends to be relatively insignificant.
In this article, therefore, we have tried to quantify the international trade networks of the world’s major economies in relative terms; specifically, by dividing the absolute value of their trade by the size of their trade partners’ respective GDP sizes. We already did this with Ukraine and Canada in previous articles, and found some interesting results in both cases. In this article, we will try to make similar graphs for the trade networks of China, the United States, Germany, Japan, Britain, Brazil, Russia, India, Australia, and Turkey.
Before we begin, however, it is important to note that measuring trade values is not always a simple process. There are a number of reasons why the following graphs should be viewed with a grain of salt. For example, the data they were made with may be inaccurate in some cases (the absolute trade values in data was taken from the MIT’s Observatory of Economic Complexity; the GDP data was taken from the World Bank). It also only includes trade in goods, ignoring trade in services, international investment flows, illegal smuggling, or tourism.
Arguably, the data can also be misleading in some instances, because it over-emphasizes trade hubs like Singapore, Hong Kong, Belgium, and the Netherlands (and, as a result, perhaps under-emphasizes the trade of countries that are closely commercially integrated with these trade hubs, such as Germany or China). It also treats Hong Kong as an independent economy rather than as part of China, which it probably should not do. Finally, since the Observatory of Economic Complexity only gives data for countries’ top 20 absolute trade partners, in most cases these graphs will still ignore some small countries. For example, the Bahamas probably has a huge relative trade relationship with the US, but it was still too small in absolute terms to be included.
All that being said, I think these graphs might be interesting and instructive. So, here they are:
China – Exports: $2.1 trillion, Imports:$1.4 trillion
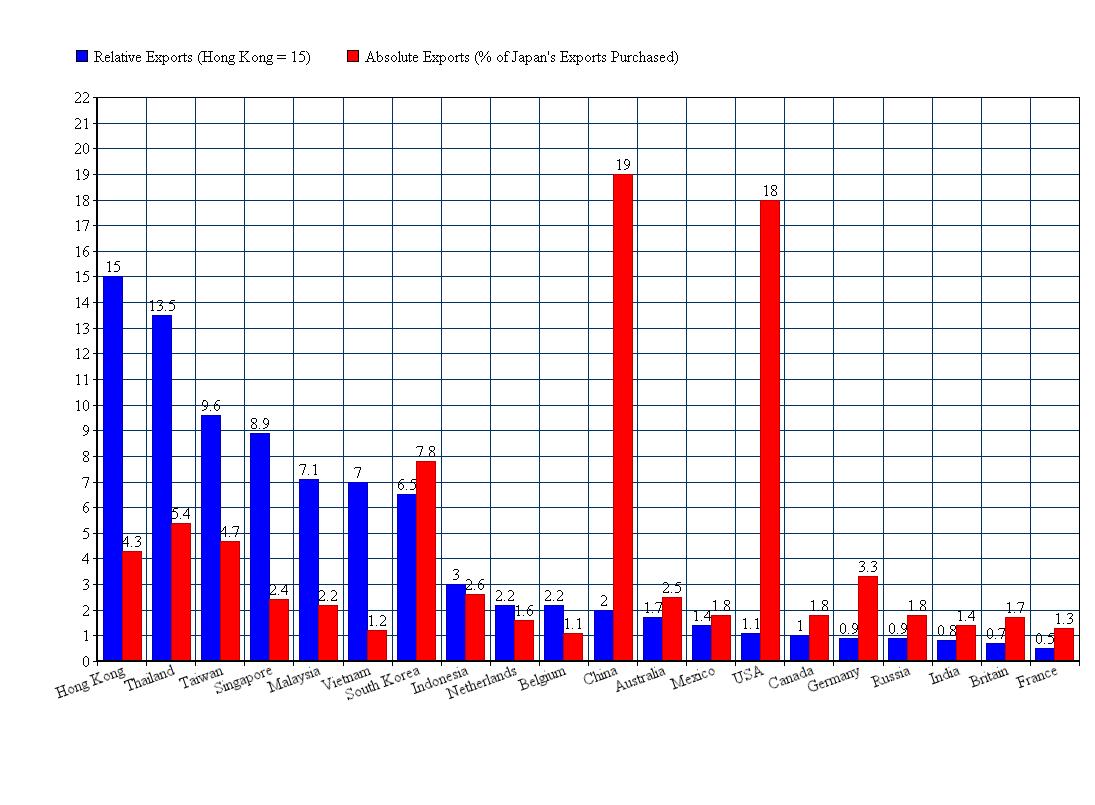
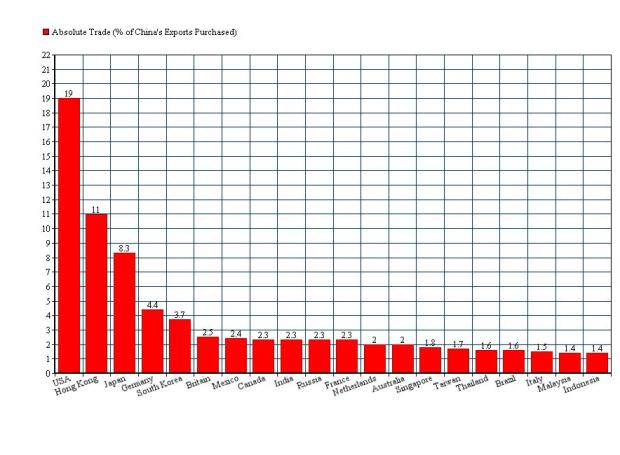 In the graph above we see China’s “absolute” export patterns – in other words, the type of trade patterns we would normally hear about in the media. The US buys an estimated 19 percent of China’s exports, Hong Kong buys an estimated 11 percent of China’s exports, Japan buys 8 percent, and so on. In the graph below, however, we see China’s “relative” export patterns, which tell a very different story:
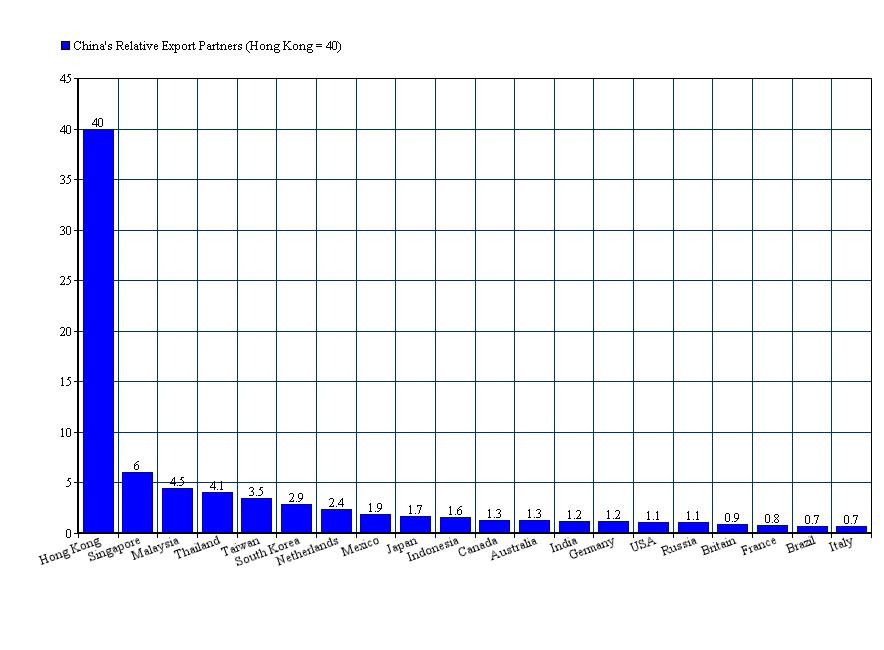 As you can see, in relative terms (i.e. relative to GDP size), Hong Kong buys way more of China’s exports than any other economy does. (And of course, as we said earlier, Hong Kong should actually probably be considered part of China). Singapore and Malaysia, both of which are partially Chinese-inhabited, are next after Hong Kong, followed by Thailand, Taiwan, and South Korea. The US, meanwhile, which had a strong lead in China’s “absolute trade” export patterns, scores very low in this relative trade graph.
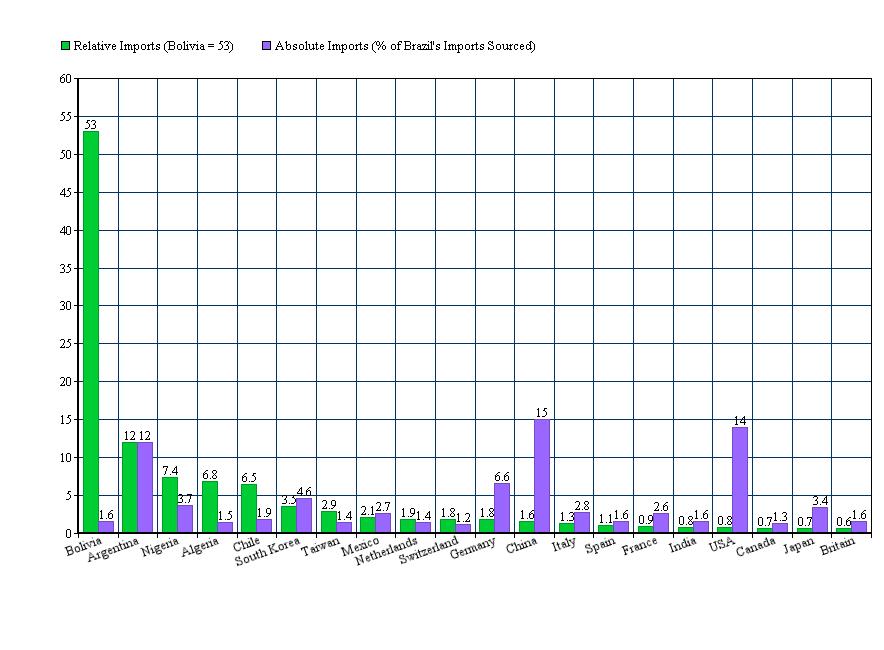
 Here we see China’s import patterns, both relative and absolute. The US, though it supplies China with an estimated 8 percent of its overall imports, scores at the very bottom of China’s relative imports list, far behind every other country apart from France. Hong Kong again scores number one in terms of relative trade, but its dominance on relative imports is not nearly as high as it was with exports (this is because most of China’s imports from Hong Kong’s are of services, rather than goods, and the data here does not include services). Taiwan, conversely, is much higher on this imports graph than on the exports graph above. Angola, which was not even on the exports list, scores extremely high in terms of relative imports, because of the oil it supplies China with. Other resource suppliers like Chile, Saudi Arabia, Iran, and Australia also have higher scores on this relative imports list.
USA – Exports: $1.3 trillion, Imports: $1.8 trillion
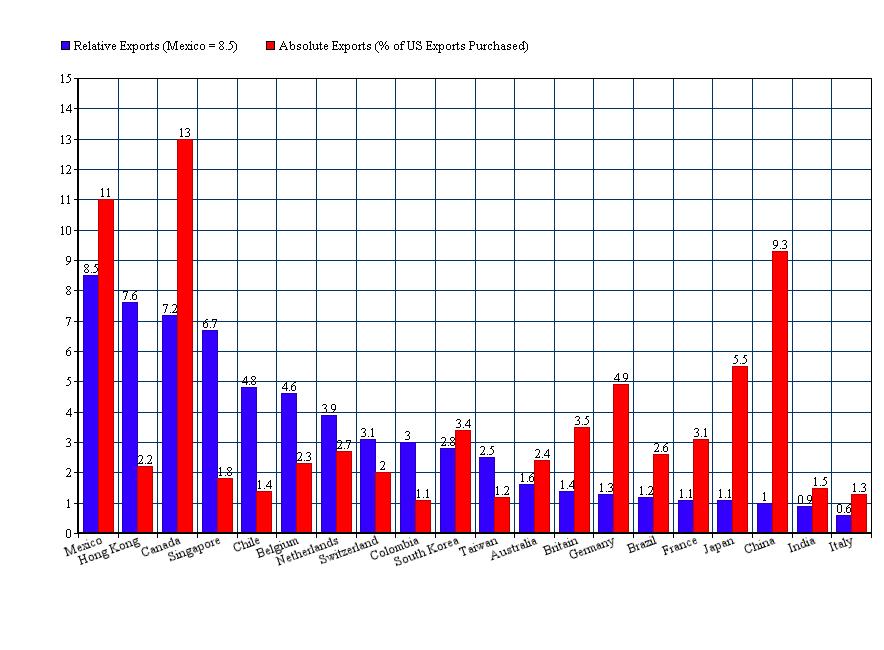 Here we see that Mexico is higher than Canada in relative terms, even though Canada is higher in absolute terms. We see that Hong Kong is very high in relative terms, more than 7 times higher than China is (though perhaps most of the US’s exports to Hong Kong are really going to China anyway), as is Singapore. Latin American countries like Chile and Colombia score high in relative terms, as do Belgium, the Netherlands (though both may be trade hubs for US exports to other European countries), and Switzerland. US allies South Korea and Taiwan also score high in relative terms. Major economies like Britain, Germany, France, Japan, China, India, and Italy all score very low in relative terms.
 For US imports, Mexico actually scores almost twice as high as Canada in relative terms (and this does not even include massive narcotics imports from Mexico). Ireland and Vietnam both score very high (higher even than Canada), followed by Colombia, Thailand, South Korea, Taiwan, and China. China scores much higher here than it did in terms of US exports. Nigeria also scores highly, since it sells oil to the US. For the US’s absolute imports, four countries dominate: China, Mexico, Canada, and Japan.
Germany – Exports: 1.32 trillion, Imports: $1.09 trillion
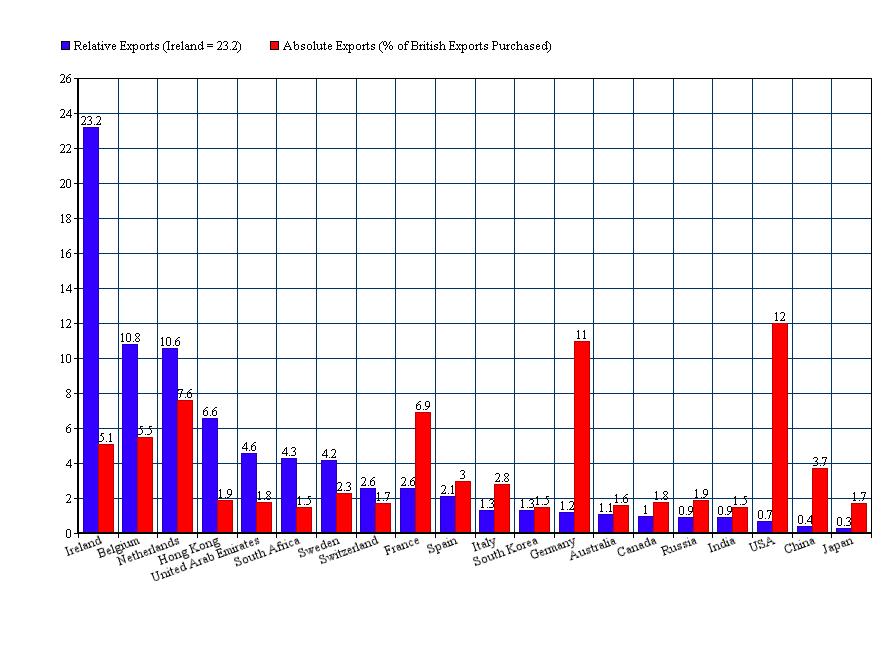
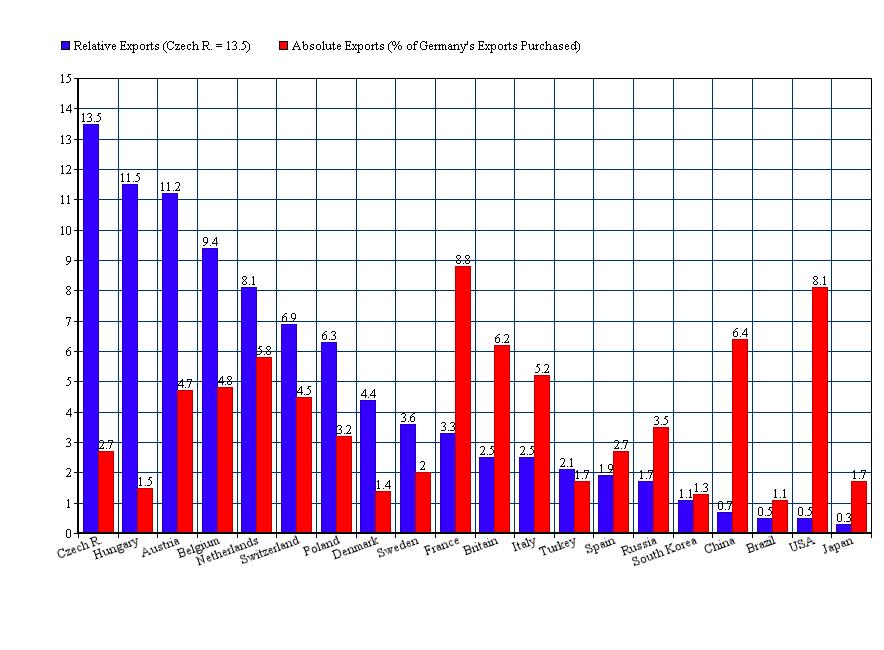 It is interesting to note that France, which buys more of Germany’s exports than any other country does in absolute terms, scores far lower in relative terms than most of the countries in Central and Eastern Europe. Given that most Eastern European countries are still developing, the fact that their relative imports from Germany are so high could be especially significant. Also notable is how tiny the relative exports of Germany to countries like China, the US, and Japan are. Germany is in general the most export-dependent of any economy we will look at in this article.
 In terms of Germany’s relative imports, the Czech Republic and Hungary are again at the top of the list, this time joined by Slovakia. Britain scores lower on this list than it did in the exports list. Norway, which sells oil and gas to Germany, scores much higher. Russia, which also sells oil and gas to Germany, does not score higher, however (though it may be that much of this oil flows through the Netherlands, and is counted as a German import from the Netherlands instead of from Russia). The US scores extremely low.
Japan – Exports: $794 billion, Imports: $793 billion

Britain – Exports: $434 billion, Imports: $615 billion

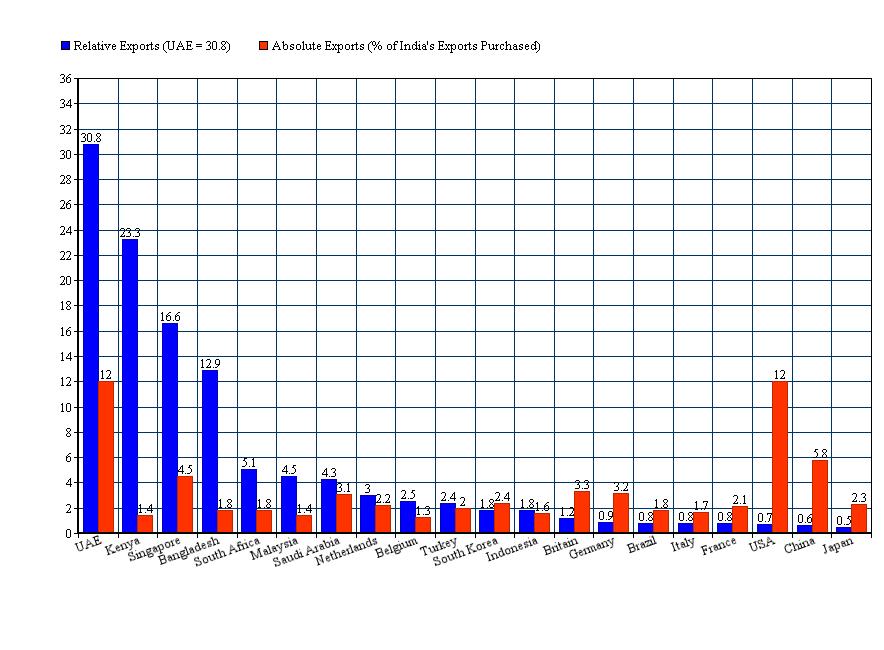
India – exports: $275 billion, imports: $ 448 billion

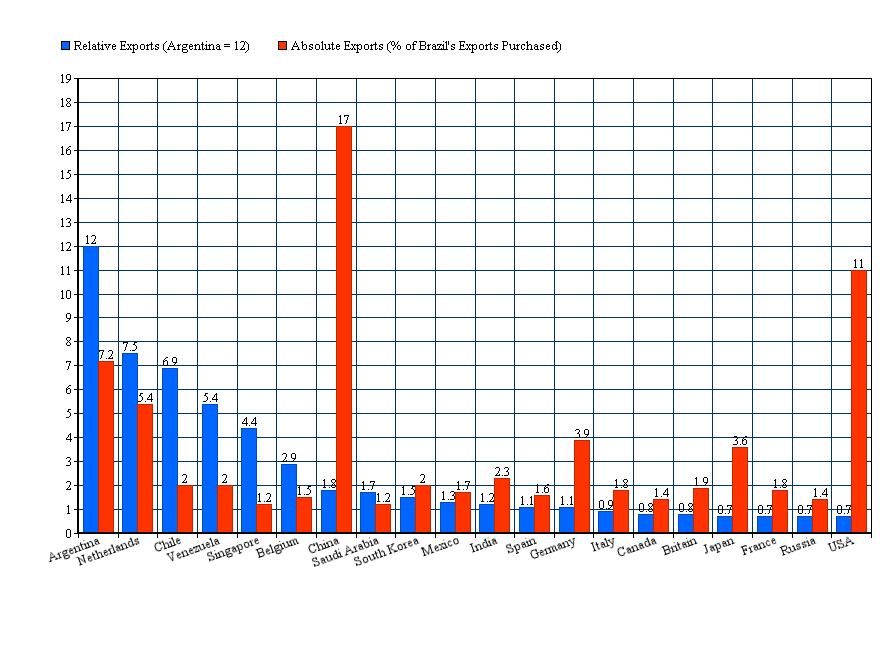
Brazil – exports $247 billion, imports $223 billion
Russia – exports $470 billion, imports $324 billion


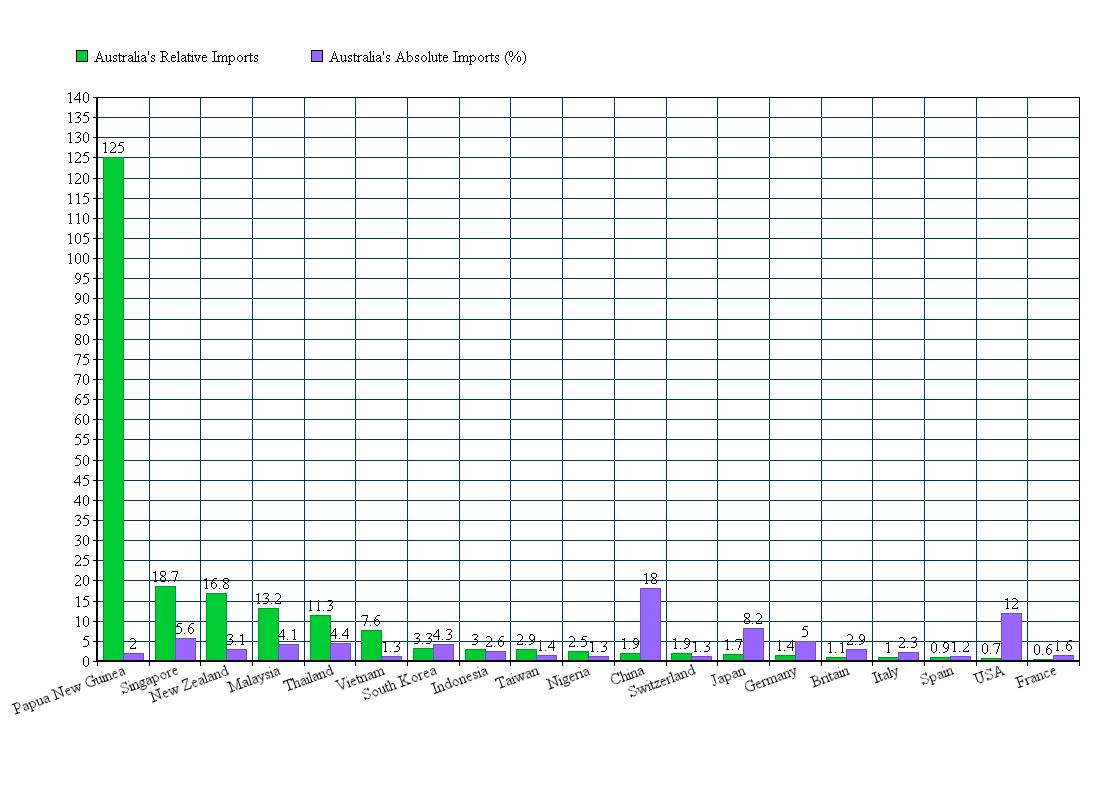
Apart from the countries we have looked at so far, France and Italy are the two largest economies in the world in terms of nominal GDP, according to the World Bank. However, since we have already looked at two European countries (namely, Germany and Britain), I made graphs for Australia and Turkey instead. Australia and Turkey are listed as the world’s 12th and 17th largest economies in terms of nominal GDP.
Australia – exports: $249 billion, imports: $240 billion

Turkey – exports: $161 billion, imports: $205 billion


4 Comments