Let’s talk, very quickly, about Pierre Elliott Trudeau, Justin Trudeau, and the resurrection the Liberal Party in Canada underwent during the country’s most recent election, 20 months ago.
Before Justin Trudeau became Prime Minister at the end of 2015, the Liberals controlled only 34 of the 308 seats in Parliament. They had become the third party for the first time in their history. They had not won a majority of seats in Quebec for nine consecutive elections–not since Pierre Elliott Trudeau won big in Quebec in 1980.
Today, on the other hand, the Liberals have the largest majority in parliament that any party has won since the election of 1984 (the same year that Pierre left office), and they control a majority of Quebec’s seats to boot.
If you look at the electoral map from Justin Trudeau’s first victory in 2015, and the map of Pierre Elliott Trudeau’s final victory in 1980, you will see that the similarities between the two elections may or may not stand out more than their differences.
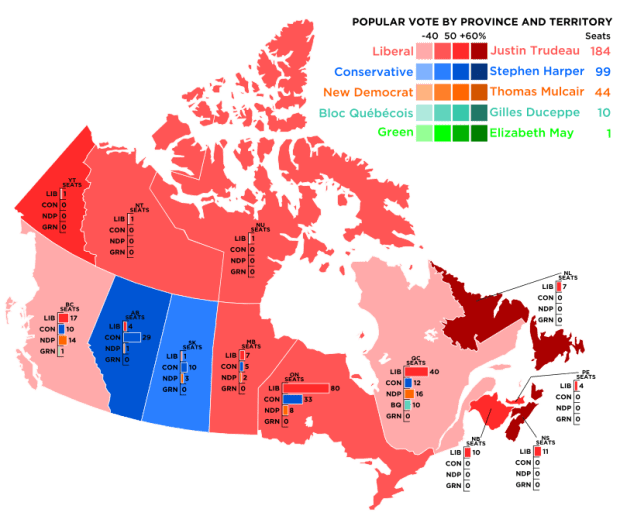
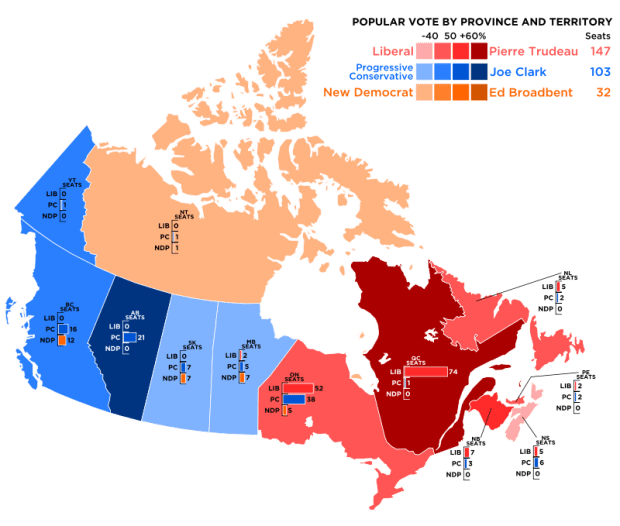
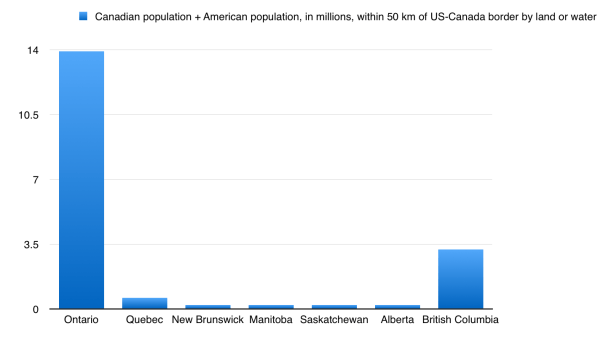
In both elections there was a clear East-West divide. The Liberals fared far better to the east of the Ontario-Manitoba border than they did to its west, regardless of which Trudeau was on the ticket. Both won flat-out majorities in Ontario, Quebec, New Brunswick, and Newfoundland, and both won a significant majority of seats throughout the country as a whole.
Justin Trudeau, however, fared far better than his father in the Maritime provinces (he swept all 32 ridings, whereas his father lost in Nova Scotia), worse in Quebec (he won 51 percent of Quebec’s seats; Pierre won 99 percent), and better in Ontario (66% vs 55%), Manitoba (50% vs 14%), Saskatchewan (8% vs 0), Alberta (12% vs 0), and British Columbia (40% vs 0). Further north, Justin swept the Territories’ three ridings; his father lost all three.
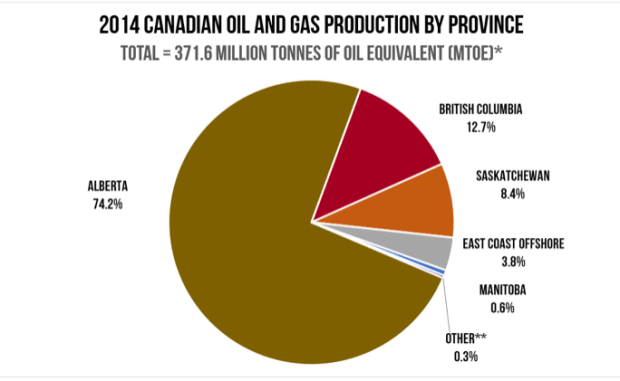
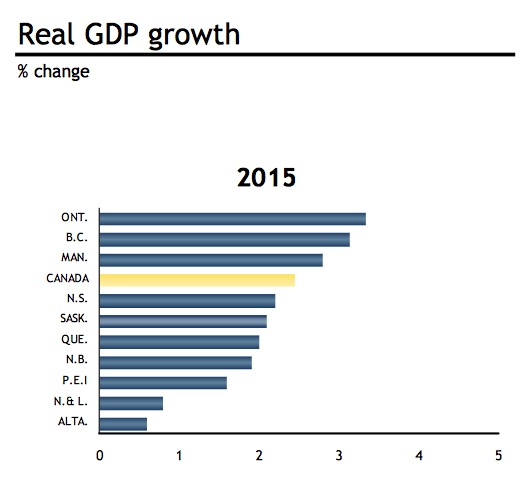
Two other important differences between 2015 and 1980 were the price of fossil fuels and the strength of the North American economy. In 1980 the price of oil was over 100$ per barrel when adjusted for inflation; during Justin Trudeau’s victory in 2015 oil was only at 40$ a barrel, having dropped by 60$ in the fifteen months leading up to election day. And while the economy of the United States was in relatively decent health in 2015, in 1980 it was still in the midst of “stagflation“, with negative GDP growth and an unemployment rate around 6-7%.
I’ll close here by showing a graph I made which I think is interesting, but which probably (definitely) should be taken with a very large grain of salt. The graph shows a relationship between four variables: the price of crude oil (in West Texas Intermediate prices, adjusted for inflation); the employment rate in the United States (which we are using as a proxy for American economic health in general); the success of Conservative parties* and the NDP in Canadian federal elections; and the success of the Liberals and Bloc Quebecois in elections. The basic idea is that because western Canada benefits from expensive oil whereas eastern Canada depends more on a strong American economy, and because Conservatives and the NDP are generally more associated with western Canada whereas the Liberals and Bloc are associated with the eastern half of Canada, there should, maybe, be some links between these variables:
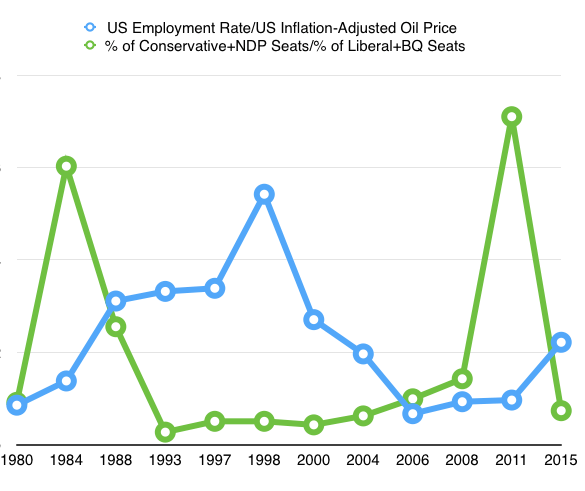
This graph covers the same time period, from Pierre Trudeau’s final election in 1980 to Justin Trudeau’s first election in 2015. It shows that in the elections immediately following Pierre’s departure and immediately preceding Justin’s arrival – namely, in the elections of 1984 and 2011 – the Conservatives and/or NDP did extremely well relative to the Liberals and/or Bloc Quebecois. In 2011 Harper won his only majority government and the NDP become the official opposition for the first time ever, while in 1984 Pierre Trudeau resigned prior to the election and Mulroney’s Progressive Conservatives won by the largest margin in Canadian history.
Every year shown on the graph above corresponds with a Canadian federal election, with the exception of 1998. 1998, however, was the year in which oil prices fell to their lowest point in nearly a century, even as the American economy was not in a recession, as it usually is when oil prices fall. With US employment high and oil prices low, the blue line on the graph above is far higher than in any other year. In the subsequent election, in 2000, Jean Chretien would go on to win a large majority for the Liberals, and the BQ a majority of ridings in Quebec. 2000 was the last time that any party won a majority government until 2011, and the last time the Liberals won a majority until 2015.
For more on this subject, check out Trudeau Walks A Tightrope, published on MacroGeo earlier this week.
