China’s Hidden Regionacracy, part 1: China’s Borderlands

chinese_provinces-mapChina_density-popChina_topo1941_China_from_the_East

How can one measure China’s economic stability? In the West, it is common to look to Hong Kong and Tibet as litmus tests of the strength of the central Chinese government. While it is true that both Hong Kong and Tibet are very important places, their combined populations do not account for even one percent of China’s overall inhabitants.

To get a better sense of China’s stability, then, one must also examine the other areas of China where the dictates of the central government are most likely to be resisted. Arguably, these include the following six regions: Southwestern China (namely, the provinces of Yunnan and Guizhou, plus the “Autonomous Region” of Guangxi), Southeastern China (the provinces of Guangdong, Fujian, and Hainan), Northeastern China (the provinces of Heilongxiang and Jilin), the Sichuan plateau (the province of Sichuan and “Direct-controlled Municipality” of Chongqing), and the “Autonomous Regions” of Xinjiang and Inner Mongolia.

These regions have a total population of over half a billion. They are home to a majority of China’s 120 million or so ethnic minorities, 300-400 million speakers of languages other than Mandarin, tens of millions of speakers of dialects of Mandarin that are relatively dissimilar to the Beijing-based standardized version of Mandarin, 20-30 million Muslims, 50-100 million recent adopters of Christianity, and tens of millions of family members of the vast worldwide Chinese diaspora.

Together, these regions form a cordon around the flat, triangle-shaped Chinese heartland that extends for more than a thousand kilometres from Beijing to Shanghai, where most of the rest of China’s population lives. Several other provinces, meanwhile, such as Shanxi, Gansu, Hunan, and the Hui Muslim “Autonomous Region” of Ningxia, arguably fall somewhere in between China’s central and peripheral territories, from both a geographical and political perspective.

Along with the high-altitude Tibetan(-Qinghai) Plateau and the Chinese Himalayas, these six peripheral regions possess by far the most rugged, expansive, and insular terrain within China. Their territories consist either of:

  • subtropical hills and mountains (throughout most of Southeastern and Southwestern China)
  • vast semi-desert plateaus (in Xinjiang and Inner Mongolia)
  • enormous mountains (in Xinjiang, where mountains cover an area larger than England and regularly reach heights higher than the highest Rockies)
  • mountainous or hilly islands (within the archipelagic coastal waters of Southeastern China, in places like Hong Kong, Macau, Hainan province, Xiamen, Zhoushan, Pingtan County, and nearby Taiwan)
  • mountain-enclosed riverlands (in Sichuan and Northeastern China)

Not surprisingly, Chinese central governments, whether they are controlled by ethnic Han Chinese as is the case today, or else by outside invaders like the Manchu or Japanese as was the case for most of the past half-millenium, have almost always had trouble subduing most or all of these areas.

Indeed, China’s peripheral regions contain all of China’s land borders, which are the longest in the world, more than two thousand kilometres longer than all of Russia’s land borders and well over double the length of the continental United States’. These borders remain almost impossible for the Chinese government to fully control, not only because of their incredible length and difficult terrain, but also because they are located an average of between one and a half thousand and three thousand kilometers away from the Chinese heartland. Only two significant railway lines cross the western half of this enormous distance as of yet.

Complicating matters further, China’s borders are shared with fourteen different countries, nearly all of which possess either ethnolinguistic or religious ties with the areas of China they are adjacent to. These include:

  • the long Himalayan border that separates Tibet from India, Nepal, and Bhutan, across which the exiled Tibetan Buddhist leadership resides
  • the even longer border that seperates Inner Mongolia (where more than one-fifth of the population are ethnic Mongols) and Xinjiang from the country of Mongolia (which in turn shares a three and a half thousand kilometer-long border with Russia)
  • the Manchurian-Korean border, where China is terrified of millions of refugees flowing in from North Korea in the event of a disaster there, and where nearly two million people living in the Manchurian provinces of Heilongxiang and Jilin are already Korean
  • the twin Siberian borders with Xinjiang, Inner Mongolia and Manchuria; Xinjiang’s borders with Khazakstan, Kyrgystan, Afghanistan, Pakistan, and Kashmir, where, as in Xinjiang, a plurality of the population is Muslim and/or ethnolinguistically Turkic
  • the southeastern and southwestern Chinese borders with Southeast Asia, throughout which there is a diaspora of tens of millions of southern Chinese, and where ethnic minority populations span both sides of China’s borders with countries like Myanmar and Vietnam.

As the economies of these peripheral Chinese regions as well as China’s neighbouring countries emerge, as in recent years many have begun to do at a faster pace than the Chinese economy has as a whole, they may deepen this array of cross-border relationships, and in turn could undermine efforts by China’s central government to enforce national unity within the huge Chinese economic and political system. The Chinese have certainly been worried about their neighbours within the relatively recent past: China sacrificed hundreds of thousands of its citizens during the Korean War in the 1950’s and then thousands during the Sino-Vietnam War in 1979, which, as a point of comparison, may be more casualties than the United States has suffered in all of the wars it has ever fought put together.

Since the 1980’s, however, as the China-US alliance took root and the Chinese economy began rapidly expanding, and as the economic growth of most of China’s neighbours collapsed in the early 1990’s (Japan and the Soviet Union), late 1990’s (South Korea, Taiwan, Southeast Asia, and British-era Hong Kong), or during the the 2008 global recession (Russia, Japan, Taiwan, Europe, and North America), while around the same time the power of China’s English-speaking rivals became preoccupied with Afghanistan and Iraq throughout the 2000’s, China has not had to worry about its borderlands nearly so much.

This is not to say that these regions were problem-free during this period. The Chinese government has in fact been concerned with many of them, including, for example:

Yet all such risks proved to be manageable ones, eased as they were by the amazing Chinese economic boom that was then still in full swing, and by the fact that China, which until 2010 still had an economy thought to be smaller than Japan’s, had not yet attracted the full attention of other powers intent on containing it.

Lately, in contrast, just as the United States has been disengaging from Afghanistan and Iraq and the economies of the US and Britain have begun speeding up again following their multi-year post-recession slog, and just as Japan, which continues to have the third largest economy in the world by a large margin, has finally begun to rebuild its will to implement an aggressive economic stimulus program and outwardly post-pacifistic foreign policy, many of China’s peripheral provinces and most of the countries surrounding China either grew or accelerated their economies at a faster pace than did the overall Chinese economy, which has slowed significantly in recent years.

In some of these areas, for instance on both sides of the border between south-western China and northern and eastern India, growth in 2014 accelerated at a much faster pace than in China as a whole. While China’s overall economic growth nevertheless remains quite strong compared to most of the rest of Asia and the world – at least, according to Beijing’s own official estimates, which admittedly are dubious – this constellation of recent trends does not bode well for its central government going forward.

Internal Chinese Geopolitics, part 1

How can one measure China’s stability? In the West, it is common to look to Hong Kong and Tibet as litmus tests of the strength of the central Chinese government. While it is true that Hong Kong and Tibet are important places — Hong Kong because it one of China’s major financial and service centres, Tibet because it encompasses around 15 percent of China’s territory and contains the headwaters of China’s, India’s, and Southeast Asia’s most important rivers — the inhabitants of Hong Kong and Tibet do not even account for 1 percent of China’s overall population.

To get a better sense of China’s political stability, then, one must also examine the other areas of China where the dictates of the central government in Beijing are most likely to be resisted. Arguably, these include the following seven areas: the Sichuan basin, Southwestern China, Southeastern China, Northeastern China (formerly known as Manchuria), the Shanghai Municipality, and the “Autonomous Regions” of Xinjiang and Inner Mongolia.

With the exception of Shanghai, not a single person born in any of these areas has become the ruling General Secretary of the Communist Party of China or the Premier of the People’s Republic of China. And yet, taken together, these areas have a population of almost 600 million people – close to half of China’s total population. So, let’s take a brief look at each one of them:

The Sichuan Basin –  Population: 111 million

See that red circle in the centre of China’s population density map (pictured below), and the greenish-yellow circle in the centre of China’s physical topography map (pictured below that)? That is the Sichuan basin, which consists of the province of Sichuan (population 81 million) and the city-state of Chongqing (population 30 million).

2BCKPUB

Topographic-map-of-China-2005

Close up topography of the Sichuan basin and surrounding areas: 

Physical map of Sichuan.

To the west of the Sichuan basin is the sparsely populated Tibetan plateau, which is more than 4000 metres higher above sea level than Sichuan is (to put that into context, the tallest building in Manhattan is only 540 metres tall). South and southeast of Sichuan there are mountains and plateaus that are about 1000 metres higher than Sichuan. To the east there are also mountains, which separate Sichuan from the middle reaches of the Yangtze River valley, where the elevation is about 350 meters below that of Sichuan. And to the north there are a series of high mountain ranges and narrow valleys that have historically helped to insulate Sichuan from the northeastern coastal plain where most Chinese people live.

The Sichuan basin’s geographic insularity and large population (larger than any single Chinese province) have historically made it one of China’s more independent-minded regions. In the 3rd century AD, for instance, during China’s famous Three Kingdoms era, a state basically corresponding to modern-day Sichuan was one of China’s three independent political entities (see left map below). A somewhat similar thing occurred in the 10th century AD (see right map below).

250px-China_5Five_Dynasties_Ten_Kingdoms_923_CE

More recently, Sichuan played a significant role during the Xinhai Revolution just prior to WW1, which overthrew China’s last emperor, and during the “Warlord Era” which followed it. Sichuan then became a critical component of the Communist Party’s rebellion against the ruling Chinese Nationalists during the Chinese Civil War from 1927 – 1950. Mao’s infamous “Long March” went through the outskirts of Sichuan province, for example, and one of the two largest original Communist armies during the Civil War, led by Mao’s rival Zhuang Guotao, was based there as well. Finally, after the Communists turned the tables on the Nationalists, gaining the upper hand in the Civil War, Sichuan ended up becoming the last base of the Chinese Nationalist leadership prior to its retreat to the island of Taiwan in 1949.

mainmap

Sichuan, in other words, often became a centre of resistance against whichever group, whether Chinese or foreign, happened to be ruling China at the time. Indeed, when the Japanese controlled much of China during WW2, Chongqing even became the official capital city of the parts of China that were still free of Japanese control (see map above). Much more recently, during the protests of 1989, there were actually two, rather than just one, major government crackdowns: one in Beijing’s Tiananmen Square, which most people in the West have heard of, and the other in Sichuan’s capital city of Chengdu, which very few people have heard of.

While it is difficult to speculate on the extent to which the Sichuan region may become a nuisance for China’s central government in the future, there have arguably been some troubling signs of late. Most notably, the two most prominent “purges” of high-ranking Communist Party leaders in recent times were both from the Sichuan basin.

The first was Bo Xiliai, the leader of Chongqing, who many had thought might become China’s next top leader, but instead was exiled from the Communist Party and given a life sentence in prison on a corruption charge in 2012, following a curious, alleged incident involving his wife, the Chongqing chief of police, and the murder of a British businessman.

The second was Zhou Yongkang, the former leader of Sichuan province, who was arrested on corruption charges in late 2014, only a few months ago, becoming the first member of China’s seven-person Politburo Standing Committee (the top leadership of the entire country) to be expelled from the Party since the 1980s. Many of Sichuan’s other top leaders have recently been targeted by the central government on corruption investigations as well, because of their associations with Zhou. Of course, the fact that Bo and Zhou were both the most powerful modern leaders the Sichuan basin has seen might just be a coincidence, having more to do with personal politics within the Communist Party than regional geopolitics within China as a whole. But it is somewhat suspicious nonetheless.

201301291057565481

Politically, in spite of the region’s large population, not one person born in Sichuan or Chongqing currently holds a position in any of the 43 positions in the Communist Party’s Politburo, Secretariat, or Central Military Commission, at or around the top levels of China’s political hierarchy.

And yet, all of the previous recent Communist Party leaders of Chongqing (none of whom were actually born in the region) have gone on to some of the top jobs in the entire country. Three of the past four have even become members in China’s Politburo Standing Committee, the 7-man group which de facto holds the highest Party positions of all. And before them, Deng Xiaoping, by far the most infamous post-WW2 Chinese leader apart from Mao, served as Mayor of Chongqing, and was born in one of its suburbs. (Though in Deng’s day Chongqing was more important in China than it is today, since its insular location had allowed it to serve as the capital city of “Free China” during the Japanese occupation of eastern China in WW2).

The promotion of former party chiefs of Chongqing (but not Sichuan, even though Sichuan is much larger) to top positions in the central government in Beijing might also be just a coincidence. It does, however, seem suspiciously like a divide and conquer tactic the government has been using to keep Sichuan and Chongqing apart, by winning Chongqing’s favour. Chongqing holds a particularly strategic position, as it is the spot where the Yangtze River flows out of the mountain-enclosed Sichuan basin, entering into the rest of central China and eventually reaching Shanghai on the Pacific.

Indeed, the reason Chongqing was even made a city-state to begin with — one of only four city-states within mainland China, the others being Beijing, Shanghai, and Beijing’s port city of Tianjin — may be because China’s leaders were worried about having to deal with a politically united Sichuan basin, which prior to Chongqing’s independence from Sichuan in 1997 had been China’s most populous province. This is probably also why the “Municipality” of Chongqing, unlike those of Shanghai, Beijing, or Tianjin, is the only one to have been given large rural areas around it to govern, so that it controls a population of 30 million even though its urban areas are home to around just 10 million.

The current Party chiefs of Chongqing and Sichuan are two of the youngest in the entire country. They are 51 and 58 years old, respectively; most other provincial party chiefs in China are in their sixties or seventies, and the 51-year-old Chongqing leader is actually the youngest of all 25 current members in the country’s Communist Party Politburo. Having the youngest provincial party chiefs or governors is usually not a good sign, since Beijing tends to pick the youngest, most ambitious governors for areas it is most concerned with, the idea being that such governors will be willing to do whatever is necessary in order to maintain order, so that they can later be promoted to one of the Communist Party’s highest offices. Hu Jintao, for instance, had served as the party chief of Tibet prior to becoming a major political figure. Indeed, we will continue to see the pattern of relatively young and ambitious party chiefs and governors in the other potentially trouble-making regions we will discuss in this article.

Finally, also notable is the Sichuan Earthquake of 2008. The earthquake, the epicentre of which was only about 80 km from Sichuan province’s main city of Chengdu (population 14 million), killed an estimated 80,000-90,000 people and caused an enormous amount of physical injury and property damage, leaving 5 – 15 million people homeless. It is one of the deadliest natural disasters in the world in modern times, and the deadliest in China in over three decades. By comparison, that is about 20,00 more casualties than the United States experienced in Iraq, Afghanistan, and Vietnam combined.

The Sichuan earthquake was mostly overlooked by people in the West, not only because it took place deep within the unknown Chinese interior, but also because it was overshadowed by a flurry of notable world events that took place during the months immediately following its occurrence, such as the global financial crisis, the first Obama election, the Beijing Olympics, the Russian invasion of Georgia, the first Israeli war against Hamas in Gaza, and the Mumbai terrorist attacks. The same week as the earthquake, in fact, California became the second US state to legalize same-sex marriage, and the debate discussion of this decision even got much more American news coverage than the disaster in Sichuan did.

The earthquake was, however, obviously an event of huge importance within China, and it is still quite fresh in some people’s minds. Its tenth anniversary will be approaching in 2017, the same year as China’s once-a-decade top leadership changeover. Crucially, many Chinese people believe that the central government are at least partly to blame for the earthquake (though it is difficult to know how many people believe this, given Chinese censorship). This is because the government created the gigantic nearby Three Gorges Dam, which finished being constructed just prior to 2008, and many think the weight of the dam – which can produce almost twice the electricity of any other dam in the world – and the reservoir of water it created was the catalyst for the earthquake. (Even before the earthquake, the Dam crushed the previous record for people displaced from their homes by a hydroelectric plant: the number of displaced Chinese was estimated at more than 1.2 million people, most of them from the province of Hubei, which directly borders the Sichuan basin).

And the thing about earthquakes is, of course, that you never fully know when another one is going to happen. If a second large one were to occur and affect Sichuan, it could bring back the memory of 2008 – and potential Sichuanese anger with the central government  – along with it. In fact, this may have already happened to a certain extent: China’s highest-magnitude earthquake since the Big One in 2008 occurred again in Sichuan, in 2013, only about 115 km from Chengdu. It killed an estimated 200 people (according to the Chinese government) and injured more than 10,000.

Southeastern China —  Population 154 million

350px-SoutheastChina

In a previous article, we discussed a large number of differences between southern China, where nearly all of the country’s tens of millions of ethnic minorities and hundreds of millions of linguistic minorities live, and northern China, where most of the country’s enormous majority of ethnic Chinese and Mandarin speakers live. So we will try to repeat only some of the basic facts of the region that were discussed there, and then focus specifically on why this part of China could potentially become the most problematic region for the Chinese central government to handle.

Southeastern China consists basically of three provinces: the province of Guangdong (population 107 million), which has the largest population and economy of any Chinese province, and which is the only province which borders Hong Kong; the province of Fujian (population 38 million), which is located directly across the 180 km long Taiwan Straits from Taiwan, speaks the same dialect of Chinese as is spoken in Taiwan, and, in spite of having less than 3 percent of China’s total population, accounts for perhaps 15 percent of all China’s trade with Taiwan (and China trades roughly 40 percent as much with Taiwan alone as it does with the entire US); and finally the province of Hainan (population 9 million), which is the only island province in China. The first bridge linking Hainan to the Chinese mainland (specifically, to Guangdong), is supposed to be finished between 2016 and 2020, and is likely increase Guangdong’s level of influence on the island.

As you can see from the population density map below, southeastern China is very different from northern China, in that its population centres are almost entirely situated on the country’s Pacific coast. The reason for this is that southern China, unlike northern China, has a very difficult climate and topography to deal with – it is extremely hilly, mountainous, often forested, and sub-tropical (see the other two maps below) – so that its population has moved to the only places where economic development was not extremely difficult to achieve, namely the narrow coastal flatlands that sit next to its numerous natural harbours.

China_density-pop

images

or, for a different perspective of the topographic differences between southeastern China and central-eastern China:

1941_China_from_the_East

Because southern China’s challenging geography has tended to impede internal movement of people and goods – especially in the past, but to a decent extent also in the present – southeastern Chinese coastal cities have also become relatively close to, and dependent on trade with, the outside world, with foreign economies like Japan, the United States, Canada, and Europe, as well as with Taiwan. The relationship between Hong Kong (population 7.2 million) and Britain is of course the most obvious and significant example of this, but it is not the only one. Macau (population 600,000), for instance, on the borders of Guangdong, is a former Portuguese territory that is China’s only “Special Administrative Region” apart from Hong Kong. Macau is also by far the wealthiest of any political subdivision within China, with a per capita nominal income of more than $90,000.

Pearl_River_Delta_Area

According to the Economist, Guangdong and Fujian alone account for 30-40 percent of all Chinese exports. Most of China’s gigantic global diaspora – which is 50 million strong, perhaps, and is located all over the world, but particularly in places like North America, Australia, Peru, and especially Southeast Asia – is also from Southeastern China. In fact, it has been estimated that one out of every seven Chinese Americans have their roots in the Guangdong area of Taishan, even though Taishan itself only has around 1 million inhabitants today. More recently, in the 1980s, emigrants from Taiwan and Hong Kong came to countries like the US and Canada in very large numbers. If, therefore, globalization forces continue to deepen, and if the economies of Southeast Asia and Taiwan continue to emerge, it could have a huge influence on this part of China, in a sense pulling it away from the rest of China.

Southeast Asia alone is home to an estimated 27 million Chinese people (though admittedly, these statistics vary widely depending on which numbers you trust, and on which criteria you use to define who is and is not “Chinese”, since many have been living in Southeast Asia for many generations now). Southeastern China also directly borders a potentially rapid-growing Vietnamese economy, the capital city of which, Hanoi, is only about 100 -150 km from the southeastern Chinese border, only 400 km from Guangdong’s enormous capital city Guangzhou and Hong Kong, and only 250 km from the Chinese island province of Hainan.

vietnam-map

Along with the adjacent provinces of Hunan, Jiangxi, and Zheijang, Southeastern China also has by far the most intra-Chinese linguistic diversity in the country. In it, non-Mandarin Chinese languages are spoken by an estimated 300 million people (though increasingly, most people are also able to speak the standardized, Beijing-region dialect of Mandarin) — see map below. Like Sichuan, this region has also been politically disenfranchised to a certain extent, with not a single one of China’s 43 positions in the Party’s Politburo, Secretariat, or Central Military Commission held by someone born in Guangdong or Hainan, and only one held by someone born in Fujian. Currently Beijing has also given Guangdong the second youngest party chief (aka party secretary) in the country, a 51-year-old who has spent most of his career working in Tibet.

240px-Sinitic_Languages0

Recently, this region has also been slowing economically as a result of the effect that Europe’s and Japan’s stagnant economies have had on demand for its exports. As a result, and also given the recent (and perhaps ongoing) protests in neighbouring Hong Kong, the province of Guangdong should be watched very closely at this time.

Historically, to be sure, Southeastern China has been a huge pain for Chinese central governments. From roughly 200 AD to 500 AD and from 1000 AD to 1200 AD, for example, there was a general north-south political divide in China (see maps below).

china 900 china 200

In modern times, during the anti-emperor Xinhai Revolution prior to WW1, Guangdong and Fujian were two of the original centres of the revolution. Later, in 1925, the Chinese Nationalists (the Kuomintang) set up an alternative Chinese capital city in Guangzhou, Guangdong, and from it successfully led a campaign to overthrow the government in Beijing, at which point the Chinese capital was moved to Nanjing (next to Shanghai).

Only a few years after that, in 1930, there was a very deadly civil war within China, the Central Plains War, which among other things pitted Nationalist leader Chiang Kai-Shek, who was ruling out of Nanjing, against Hu Hanmin, who had the support of the Nationalists across Guangdong and the rest of southern China. This rivlary had in fact been presaged by an earlier one in 1922, when the top Nationalist leader at the time, Sun Yat Sen, was forced to flee Guangdong from a different, more regional-minded Nationalist leader, Chen Jiongmin.

Around the same time, the Guangdong capital of Guangzhou was also one of the main bases of the Communist movement in China. The Communists were gaining momentum across various parts of southern China: in 1933, just to give one example, an alliance between a portion of the Communist movement and a portion of the Nationalist movement emerged, leading to the Fujian Rebellion: the creation a self-governing leadership in Fujian province that aimed to overthrow the Nationalist Chinese government of Chiang Kai-Shek. The provinces of Hunan and Jiangxi, directly on the border of Guangdong, also became very important for the Communists.

Finally, when the Communists took over and were about to win the Chinese Civil War, Guangdong became the final base – along with Sichuan – of the Nationalists prior to their retreat to Taiwan.

While it is probably unwise to make generalizations about Chinese history, there does seem to be a bit of a pattern here: Guangdong, or more broadly southern China, tends to resist centralized Chinese leadership. It has always seemed to lead the anti-government movements in the country, whether it be the anti-imperial uprising against the Qing Dynasty at the begining of the 20th century, the Nationalist move to overthrow the Beiyang government (which had replaced the Qing) in the Northern Expedition, the attempt by regional leaders within the Nationalist movement to get rid of the Nationalist central government of Chiang Kai-Shek that ruled out of Nanjing, the emergence of Communist movements opposed to the ruling Nationalists (with whom they had previously been allied), or, finally, the retreat and resistance of the Nationalists in the face of the ruling Communists.

chinese_provinces-map

The thing which makes southeastern China so potentially difficult for the central Chinese government, however, is not so much its history as it is its wealth. If you take Guangdong and Fujian, and add in neighbouring Taiwan, Hong Kong, Zheijang, and the Municipality of Shanghai (and we will discuss Shanghai later in part two of this article), you get a coastal region with a GDP that, as recently as 2009, was approximately 80 percent as large as the rest of all of mainland China’s other provinces put together.

Such wealth not only gives southeastern China economic influence, but has also made its internal politics complicated – and potentially dangerous – through the creation of divisions between the native inhabitants of the region’s cities, and the migrants from its rural areas and from the rural areas of poorer Chinese provinces, who are in search of work in its cities. Guangdong alone has an estimated 27 percent of China’s inter-provincial migrant population. And in China, “rural-urban” is not only a geographic or demographic distinction, but also a legal designation with significant  financial and social implications. Rural Chinese populations, even when they have moved to urban areas, are generally denied many of the social services, such as subsidized housing or education, which are provided for the native urban populations.

Finally, parts of central-eastern and southeastern China in recent years seem to have become the main centres of China’s potentially enormous transition toward Christianity. Today, according to the Economist, arguably more than 100 million people in China are Christian, up from perhaps as few as 15 million as recently as the 1990’s. If these numbers are accurate, then the growth of Christianity within China during the past two decades represents one of the largest religious adoptions in all of human history. The Economist more recently argued that the relationship between Christianity and the Communist Party in China has been becoming much more tense  in the past year.

Neighbouring Hong Kong has long had a significant Christian population, meanwhile, and remains around 10-15 percent Christian today. A number of the Hong Kong protest organizers were practicing Christians, in fact. And, notably, the Chinese government may have begun to crack down on parts of this growing Christian religion within China during the past year or so.

Southwestern China Population: 120 million

Southwestern China (containing the provinces of Yunnan, Guizhou, and the “Autonomous Region” of Guangxi, one of only two Autonomous Regions apart from Tibet, Xinjiang, and Inner Mongolia) is by far the most mountainous of any populous Chinese region. Partly as a result of this, it also has by far the most ethnic diversity in the country, with a regional population that contains tens of millions of non-Chinese peoples (most notably the 15 million or so Zhuang ethnic group), some of whose homelands extend across the Chinese border with Southeast Asian countries like Myanmar. Like the other regions discussed so far, southwestern China has historically been a challenge for Chinese central governments. During the 1950’s, for instance, in the largest southwestern province, Yunnan, an anti-Communist Islamic guerrilla insurgency took place, orchestrated in part by the Nationalists who were ruling Taiwan. Today, as in Guangdong or Sichuan, not one person who was born in southwestern China is currently serving within the highest echelons of the Chinese government.

se-asia-map_ethnicgroup

Southwestern China is the only part of China to border most of Southeast Asia. It could in the future become particularly close with the northern part of Vietnam, which is nearby, populous, and can serve as an alternative route for southwestern Chinese goods to reach the Pacific. It could also become close with Myanmar, which can serve as a direct route for it to reach the Indian Ocean via the commercially navigable Irrawaddy River (see map below), or to reach India and Bangladesh overland without having to cross the virtually impassable Himalayan Mountains and Tibetan Plateau (see other map below). Notably, Vietnam and Myanmar have seen a great deal of economic growth in recent years, and Myanmar has politically been re-opening itself to the West after decades of isolation. Economic interaction between Southwestern China and these potentially emerging countries could present some challenges for the Chinese central government.

mapasia

In addition, and also potentially troubling for the Chinese central government, the region of southwestern china also has ties to southeastern China via the Pearl River, which is by far China’s longest commercially navigable river apart from the Yangtze, and which meets the Pacific at the place where Hong Kong and Guangdong’s capital city of Guangzhou are located (see map below). Southwestern China also directly borders both Sichuan and Tibet.

Zhujiangrivermap

(In the graph above: Kunming, Guiyang, and Nanning are the capital cities of Southwestern China’s provinces. The Greater Guangzhou-Hong Kong area in Southeastern China, which has a total population of perhaps more than 50 million, is arguably the most populous urban area in the entire world)

In part two of this article we will take a look at Shanghai, Xinjiang, the former Manchuria, and Inner Mongolia. 

The 10 Largest “Relative” Trade Networks

If you follow the financial news media, you will frequently hear of countries’ largest trade partners being either the United States, the European Union, or China. As a result, it can often seem like the US, EU, and China are at the centre of massive global networks of international trade. In a certain sense, of course, they are: the combined external merchandise trade of the US, EU, and China is equal to an estimated 11 trillion dollars a year. And yet, relative to the enormous size of their GDPs, the US, EU, and to a lesser degree China do not actually trade very much compared to most other countries.

North America and Europe are in fact relatively insular in their international commercial relations. The US and the EU, for instance, trade an amount of goods estimated at around 25 percent of their GDPs; by comparison, Germany trades an amount equal to an estimated 70 percent of its GDP, South Korea trades an amount equal to roughly 80 percent of its GDP, and the Netherlands trades an amount equal to roughly 150 percent of its GDP. Even China, which is generally viewed as a highly trade-dependent economy, trades an amount that is equal to only an estimated 45 percent of its GDP, which is lower than most of the countries in the world.

In other words, the economies of the US, EU, and China only seem so trade-oriented because their massive economic size makes them the largest trade partners of a large majority of the world’s countries.  This confusion stems from the fact that the media tends to view the size of international trade values in absolute terms only, rather than by looking at the size of those trade values relative to some other relevant factor, such as the size of the GDP’s of the countries involved in the trade. By looking only at absolute trade values, the huge economies of the US, EU, and China end up getting almost all of the public attention, even though their “relative” trade with most other countries actually tends to be relatively insignificant.

In this article, therefore, we have tried to quantify the international trade networks of the world’s major economies in relative terms; specifically, by dividing the absolute value of their trade by the size of their trade partners’ respective GDP sizes. We already did this with Ukraine and Canada in previous articles, and found some interesting results in both cases. In this article, we will try to make similar graphs for the trade networks of China, the United States, Germany, Japan, Britain, Brazil, Russia, India, Australia, and Turkey.

Before we begin, however, it is important to note that measuring trade values is not always a simple process. There are a number of reasons why the following graphs should be viewed with a grain of salt. For example, the data they were made with may be inaccurate in some cases (the absolute trade values in  data was taken from the MIT’s Observatory of Economic Complexity; the GDP data was taken from the World Bank). It also only includes trade in goods, ignoring trade in services, international investment flows, illegal smuggling, or tourism.

Arguably, the data can also be misleading in some instances, because it over-emphasizes trade hubs like Singapore, Hong Kong, Belgium, and the Netherlands (and, as a result, perhaps under-emphasizes the trade of countries that are closely commercially integrated with these trade hubs, such as Germany or China). It also treats Hong Kong as an independent economy rather than as part of China, which it probably should not do. Finally, since the Observatory of Economic Complexity only gives data for countries’ top 20 absolute trade partners, in most cases these graphs will still ignore some small countries. For example, the Bahamas probably has a huge relative trade relationship with the US, but it was still too small in absolute terms to be included.

All that being said, I think these graphs might be interesting and instructive. So, here they are:

China – Exports: $2.1 trillion, Imports:$1.4 trillion

China's Absolute Export PartnersIn the graph above we see China’s “absolute” export patterns – in other words, the type of trade patterns we would normally hear about in the media. The US buys an estimated 19 percent of China’s exports, Hong Kong buys an estimated 11 percent of China’s exports, Japan buys 8 percent, and so on. In the graph below, however, we see China’s “relative” export patterns, which tell a very different story:

China's relative exportsAs you can see, in relative terms (i.e. relative to GDP size), Hong Kong buys way more of China’s exports than any other economy does. (And of course, as we said earlier, Hong Kong should actually probably be considered part of China). Singapore and Malaysia, both of which are partially Chinese-inhabited, are next after Hong Kong, followed by Thailand, Taiwan, and South Korea. The US, meanwhile, which had a strong lead in China’s “absolute trade” export patterns, scores very low in this relative trade graph.

China relative and absolute importsHere we see China’s import patterns, both relative and absolute.  The US, though it supplies China with an estimated 8 percent of its overall imports, scores at the very bottom of China’s relative imports list, far behind every other country apart from France. Hong Kong again scores number one in terms of relative trade, but its dominance on relative imports is not nearly as high as it was with exports (this is because most of China’s imports from Hong Kong’s are of services, rather than goods, and the data here does not include services). Taiwan, conversely, is much higher on this imports graph than on the exports graph above. Angola, which was not even on the exports list, scores extremely high in terms of relative imports, because of the oil it supplies China with. Other resource suppliers like Chile, Saudi Arabia, Iran, and Australia also have higher scores on this relative imports list.

USA – Exports: $1.3 trillion, Imports: $1.8 trillion

us relative and absolute exportsHere we see that Mexico is higher than Canada in relative terms, even though Canada is higher in absolute terms. We see that Hong Kong is very high in relative terms, more than 7 times higher than China is (though perhaps most of the US’s exports to Hong Kong are really going to China anyway), as is Singapore. Latin American countries like Chile and Colombia score high in relative terms, as do Belgium, the Netherlands (though both may be trade hubs for US exports to other European countries), and Switzerland. US allies South Korea and Taiwan also score high in relative terms. Major economies like Britain, Germany, France, Japan, China, India, and Italy all score very low in relative terms.

us relative and absolute importsFor US imports, Mexico actually scores almost twice as high as Canada in relative terms (and this does not even include massive narcotics imports from Mexico). Ireland and Vietnam both score very high (higher even than Canada), followed by Colombia, Thailand, South Korea, Taiwan, and China. China scores much higher here than it did in terms of US exports. Nigeria also scores highly, since it sells oil to the US. For the US’s absolute imports, four countries dominate: China, Mexico, Canada, and Japan.

Germany – Exports: 1.32 trillion, Imports: $1.09 trillion

Germany relative and absolute exportsIt is interesting to note that France, which buys more of Germany’s exports than any other country does in absolute terms, scores far lower in relative terms than most of the countries in Central and Eastern Europe. Given that most Eastern European countries are still developing, the fact that their relative imports from Germany are so high could be especially significant. Also notable is how tiny the relative exports of Germany to countries like China, the US, and Japan are. Germany is in general the most export-dependent of any economy we will look at in this article.

Germany relative and absolute importsIn terms of Germany’s relative imports, the Czech Republic and Hungary are again at the top of the list, this time joined by Slovakia. Britain scores lower on this list than it did in the exports list. Norway, which sells oil and gas to Germany, scores much higher. Russia, which also sells oil and gas to Germany, does not score higher, however (though it may be that much of this oil flows through the Netherlands, and is counted as a German import from the Netherlands instead of from Russia). The US scores extremely low.

Japan – Exports: $794 billion, Imports: $793 billion

japan relative and avsolute exportsjapan relative and absolute imports

Britain – Exports: $434 billion, Imports: $615 billion

Britain relative and absolute exportsbritain relative and absolute imports

India – exports: $275 billion, imports: $ 448 billion

india relative and absolute exportsIndia relative and absolute imports

Brazil – exports $247 billion, imports $223 billion

brazil relative and absolute exportsbrazil relative and absolute imports

Russia – exports $470 billion, imports $324 billion

russia relative and absolute exportsrussia relative and absolute imports

Apart from the countries we have looked at so far, France and Italy are the two largest economies in the world in terms of nominal GDP, according to the World Bank. However, since we have already looked at two European countries (namely, Germany and Britain), I made graphs for Australia and Turkey instead. Australia and Turkey are listed as the world’s 12th and 17th largest economies in terms of nominal GDP.

Australia – exports: $249 billion, imports: $240 billion

Australia relative and absolute exports Australia relative and absolute imports

Turkey – exports: $161 billion, imports: $205 billion

Turkey relative and absolute exports Turkey relative and absolute imports

The Physics of Japanese Economics

With the downward revision of Japan’s GDP growth figures last month, the Japanese economy is technically back in recession, projected to shrink by a slight amount during the year as a whole. Even though most analysts had previously forecast Japan’s economy to expand at a rate of 2 percent in 2014, nobody was too surprised by the news that is contracting instead. The recession is the country’s fifth since 1997, and its third since the global credit crisis of 2008. While some might see a silver lining in this – namely, that Japan’s economic growth going forward could not possibly get any slower than it has already been – many economists do in fact view the country’s problems as likely to grow more rather than less acute during the years ahead.

Unlike in recent decades, Japan must now grapple with an empowered China, with slowing economic growth among key trading partners like South Korea, Taiwan, coastal Chinese provinces, and Europe, with net government debt that has risen from 80 to 145 percent of GDP over the past decade, and with a Baby Boom generation that has reached between 65 and 70 years old on average (about a decade older than those of Europe or America). These trends arguably provide the backdrop to Japan’s current slowdown, even as the catalyst for the recession has been viewed as a rise in the country’s consumption tax, from five percent to eight percent, which came into effect earlier in the year.

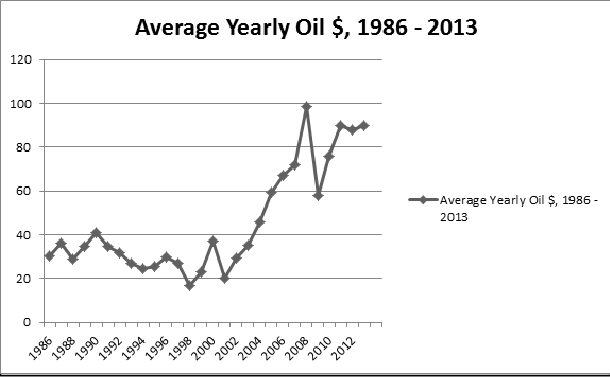
What might be more surprising than the recession itself is that investors in Japan’s stock market seem basically unperturbed by the news of it. The Nikkei 225 index is actually higher now than it was before the recession become public knowledge; it continues to trade at around a seven-year high, virtually double the price it averaged between 2008 and 2013. Admittedly, this is a far cry from the Nikkei’s all-time highs in 1992, when it was worth well over double what it is today. In fact it does not even match the highs of 2000, 1997, 1994, and several other years going back all the way, astoundingly, to 1986. That’s right: Japanese stocks were worth more 29 years ago than they are today. Still, a seven-year high amidst the onset of an economic recession is something that is difficult to ignore.

Of course, the rise in the Nikkei may simply reflect the fact that investors have become so accustomed to seeing Japan’s economy shrink that they built in the risk of a recession to the price of Japanese stocks ahead of time, which meant that those prices did not require much revising when the recession actually arrived. The Nikkei’s rise may also reflect the fact that investors have faith in prime minister Shinzo Abe, who has loudly promised to stimulate the Japanese economy and revive Japanese prestige, and who is already using the recession as an excuse to call a snap election intended to extend his party’s leadership by an additional two years, from 2016 (when parliamentary elections would have otherwise been held) to 2018. [update: the elections have now happened. Abe’s party won a two-thirds majority, though with the lowest voter turnout since WW2].

Or it may be that investors have so little faith in Europe, China, and commodity-exporting economies like Brazil or Australia, and see US equities as being too expensive now that the S&P 500 has again reached all-time highs in recent days, that they have been forced into Japan’s stock market almost by default. Finally, and most intriguingly, the Nikkei’s performance may reflect the possibility that the potential of Japan to achieve a renewed, meaningful pace of economic growth is actually more promising than most Japanese themselves recognize.

With Japan’s stock market and GDP indicators pointing, almost paradoxically, in far-opposing directions, Japan’s economy now resembles Schrodinger’s infamous Cat: its true health is in a state of uncertainty, the resolution of which seems to depend on the specific approach at which it is observed. Of course, unlike the Cat itself, Japan’s economy is a paradox that we know can probably be resolved. All we need to do is take a look underneath the lid, so to speak, at the underlying fundamentals of the country’s medium-term (say, within the next decade or two) economic prospects. What are those underlying fundamentals? It turns out that the originator of the Cat query, Albert Einstein, might be of some use here as well:

General Economic Relativity 

One of the most fundamental theories of conventional economic forecasting is the idea that, in general, countries that are relatively poor will grow at a faster pace than those that are relatively rich. This is, of course, why a country like India disappointed investors when it grew at 6.5% in 2011 and 5% in 2013, whereas even 2% growth in the European Union or 3% growth in the United States would be a widely celebrated event.

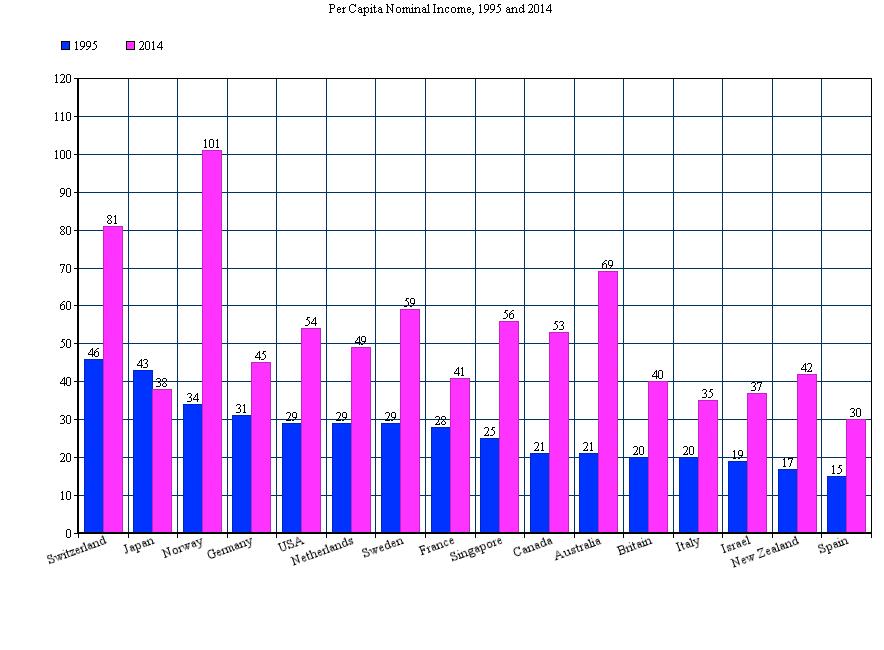
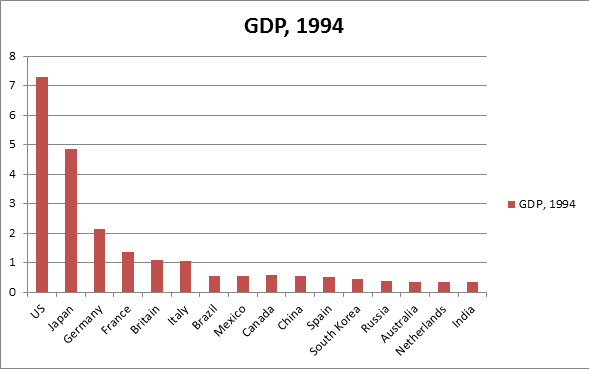
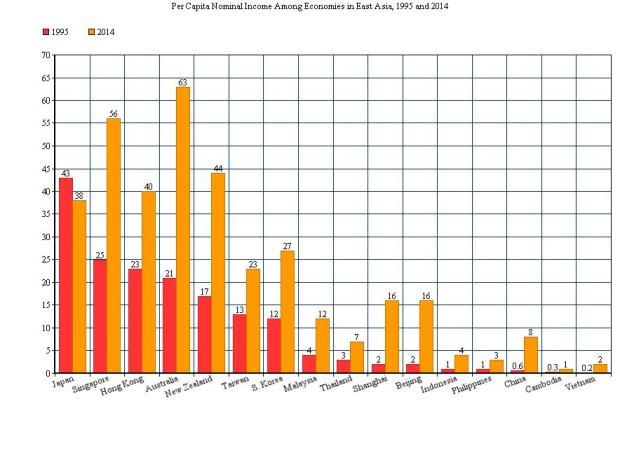
In the case of Japan, the extremely high income levels the country had two decades ago might have limited its economy’s ability to grow. According to the IMF, in 1995 Japan’s per capita income was 1.5 times higher than that of the next wealthiest large developed economy (the United States), 2 times higher than that of the next wealthiest large economy in the western Pacific (Australia), and 3.3 times higher than that of the next wealthiest economy in Northeast Asia (Taiwan). As a result of being so wealthly at the time, Japan’s room to expand its economy further may have been somewhat constrained.

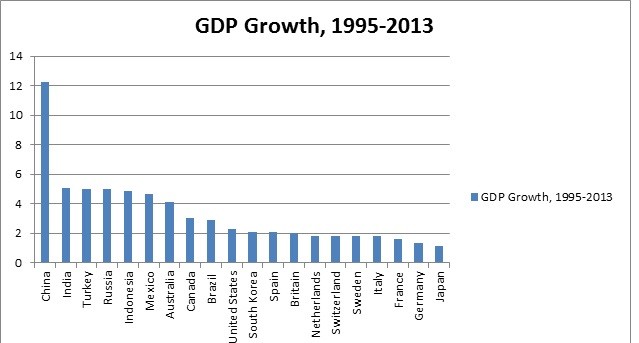
Today could scarcely be any more different. If the idea that relatively poor countries are in general likely to grow relatively quickly (i.e., the theory of general economic relativity) is to be believed, Japan is now in a much more favourable position where its growth potential is concerned. The country has become much poorer than other developed economies in terms of its per capita income, especially in comparison to regional counterparts like Australia, New Zealand, and Singapore, which have grown rapidly since the mid-1990’s. Japan’s lead over developing East Asian economies is also not nearly as large as it used to be (see charts below), as a result of the emergence of China and the strong rebound of other East Asian economies following their financial crises in 1997 and 2008. Arguably, this comparatively low level of nominal wealth bodes well for the Japanese economy going forward, relative to how it has performed during the past two decades.

20150123080225

20150125095027

Special Economic Relativity 

Another fundamental principle of economics is that of “comparative advantage”, the idea that economies will tend to construct themselves in ways that reflect their greatest advantages (or smallest disadvantages) in relation to other economies. This begs the question: what makes Japan special, relative to other countries? More to the point: is what makes Japan special likely to help its economy grow at a decent pace during the years ahead?

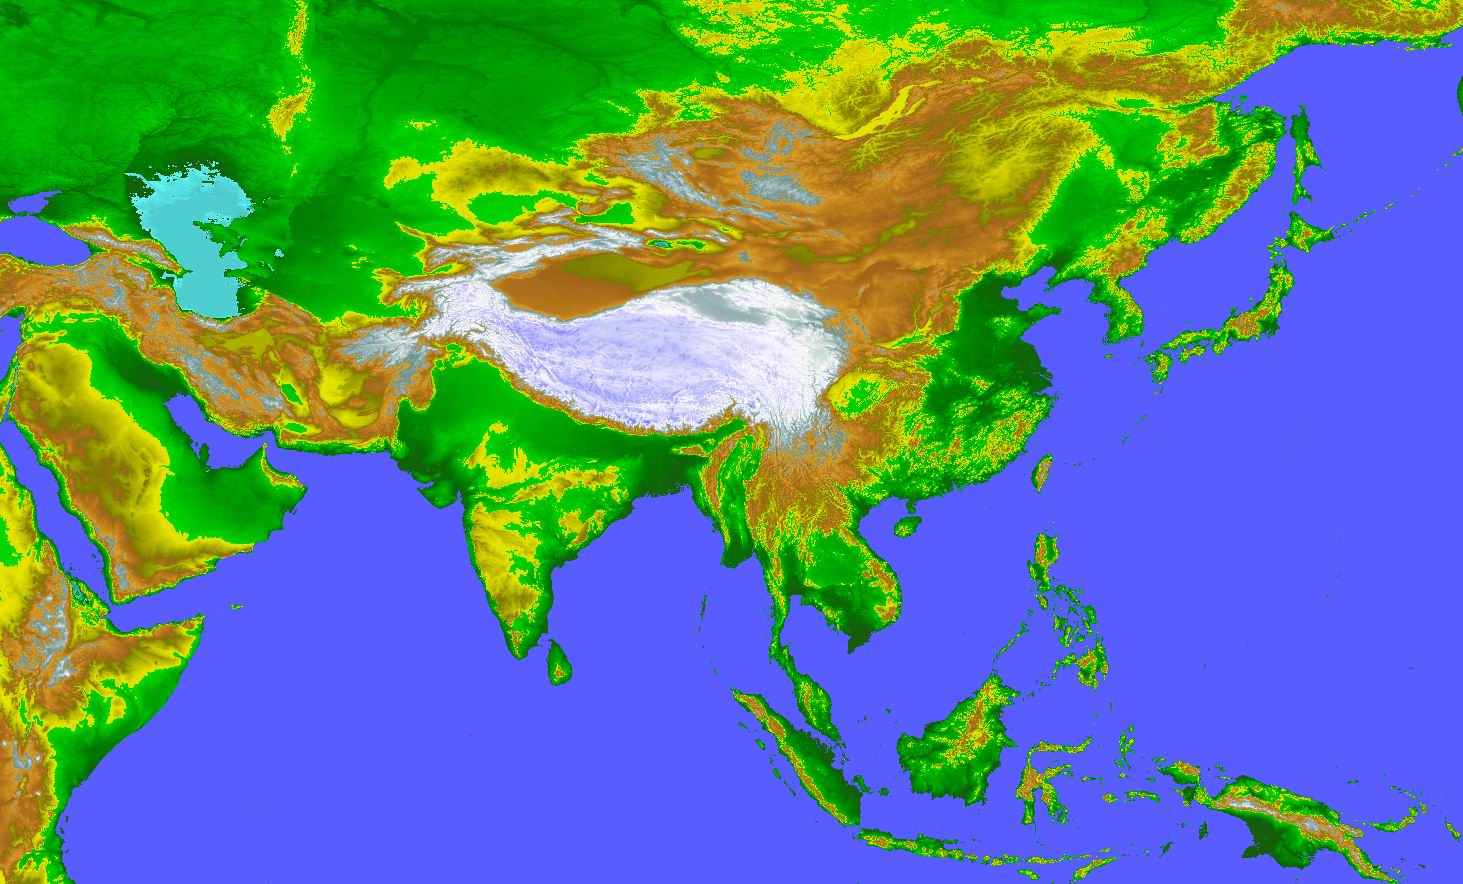
One of the main qualities that makes Japan special is its “economic mass”. This does not only refer to its economic size — Japan’s economy is the third largest in the world, 1.7 times larger than fourth-place Germany and just 1.6 times smaller than second-place China, according to the World Bank — but, just as important, refers also to Japan’s internal unity and compactness. Unlike in other major economies like the US or China, Japan’s population is not spread out over a vast territory, but is instead crammed into an area that is only about the size of Montana. Japan’s economic activity is even more highly concentrated: the Greater Tokyo Area alone accounts for an estimated 40 percent of Japanese GDP, and the island of Honshu (in which Tokyo is located) for upwards of 80 percent of Japanese GDP.

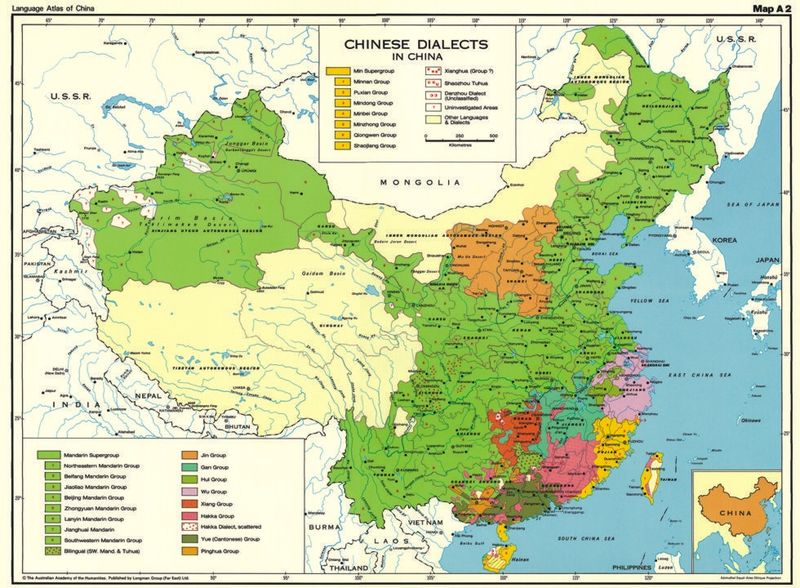
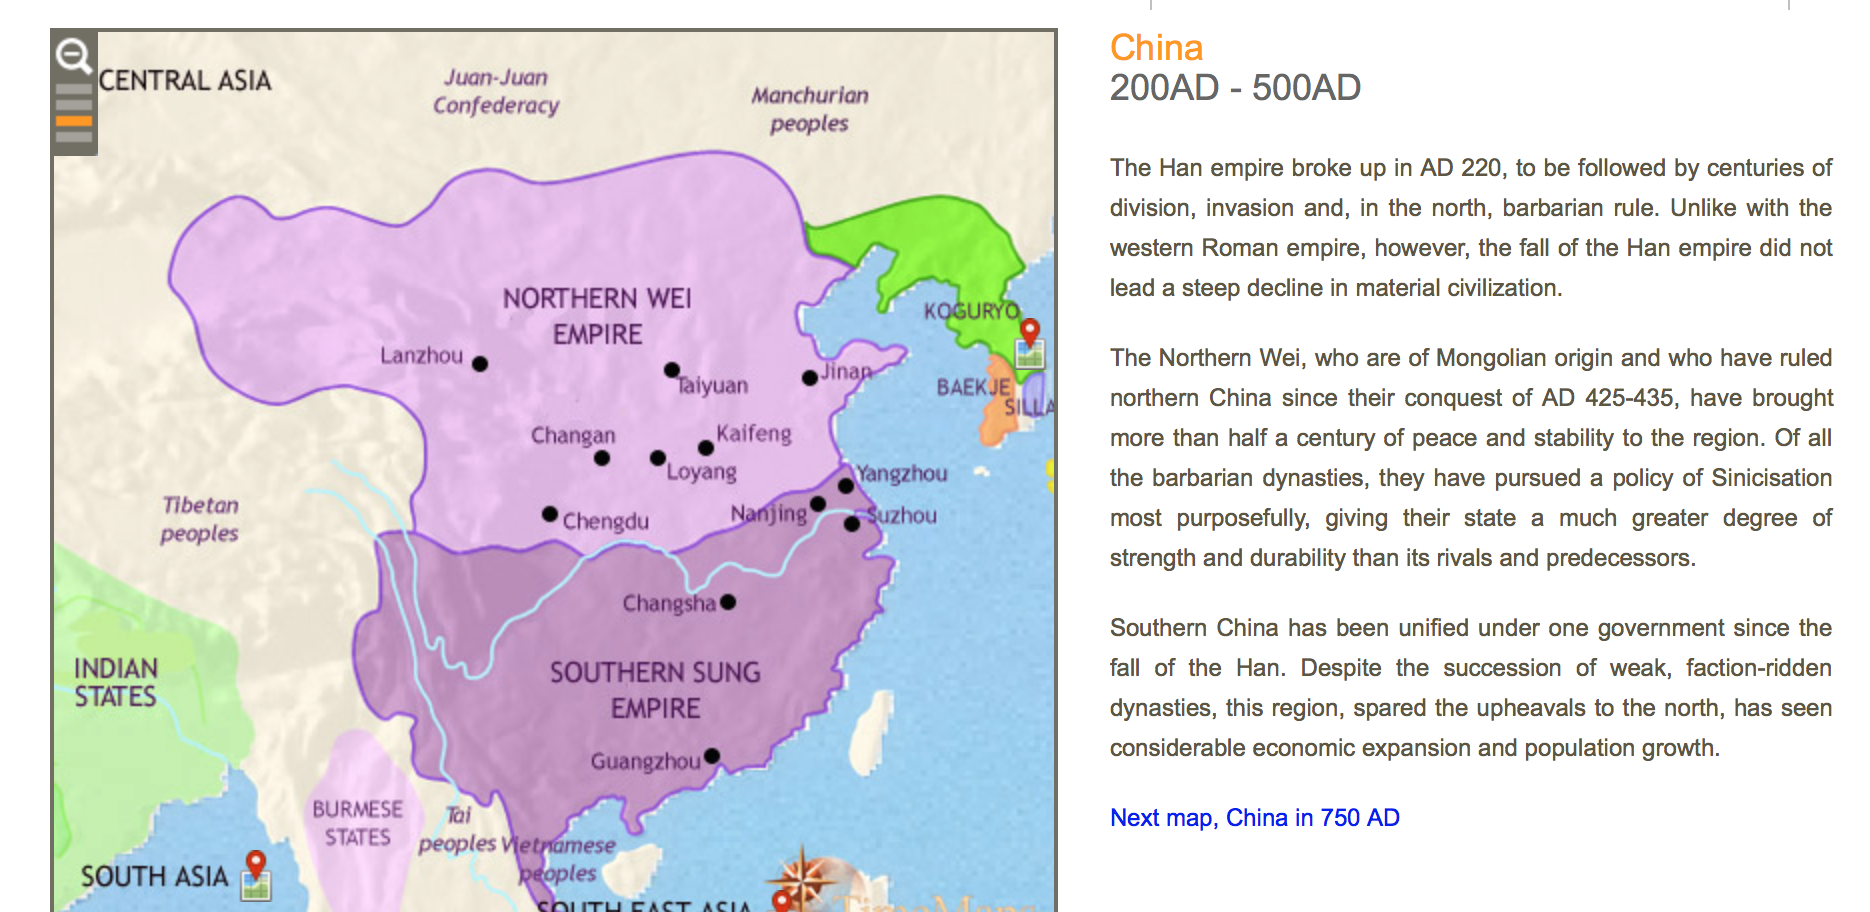
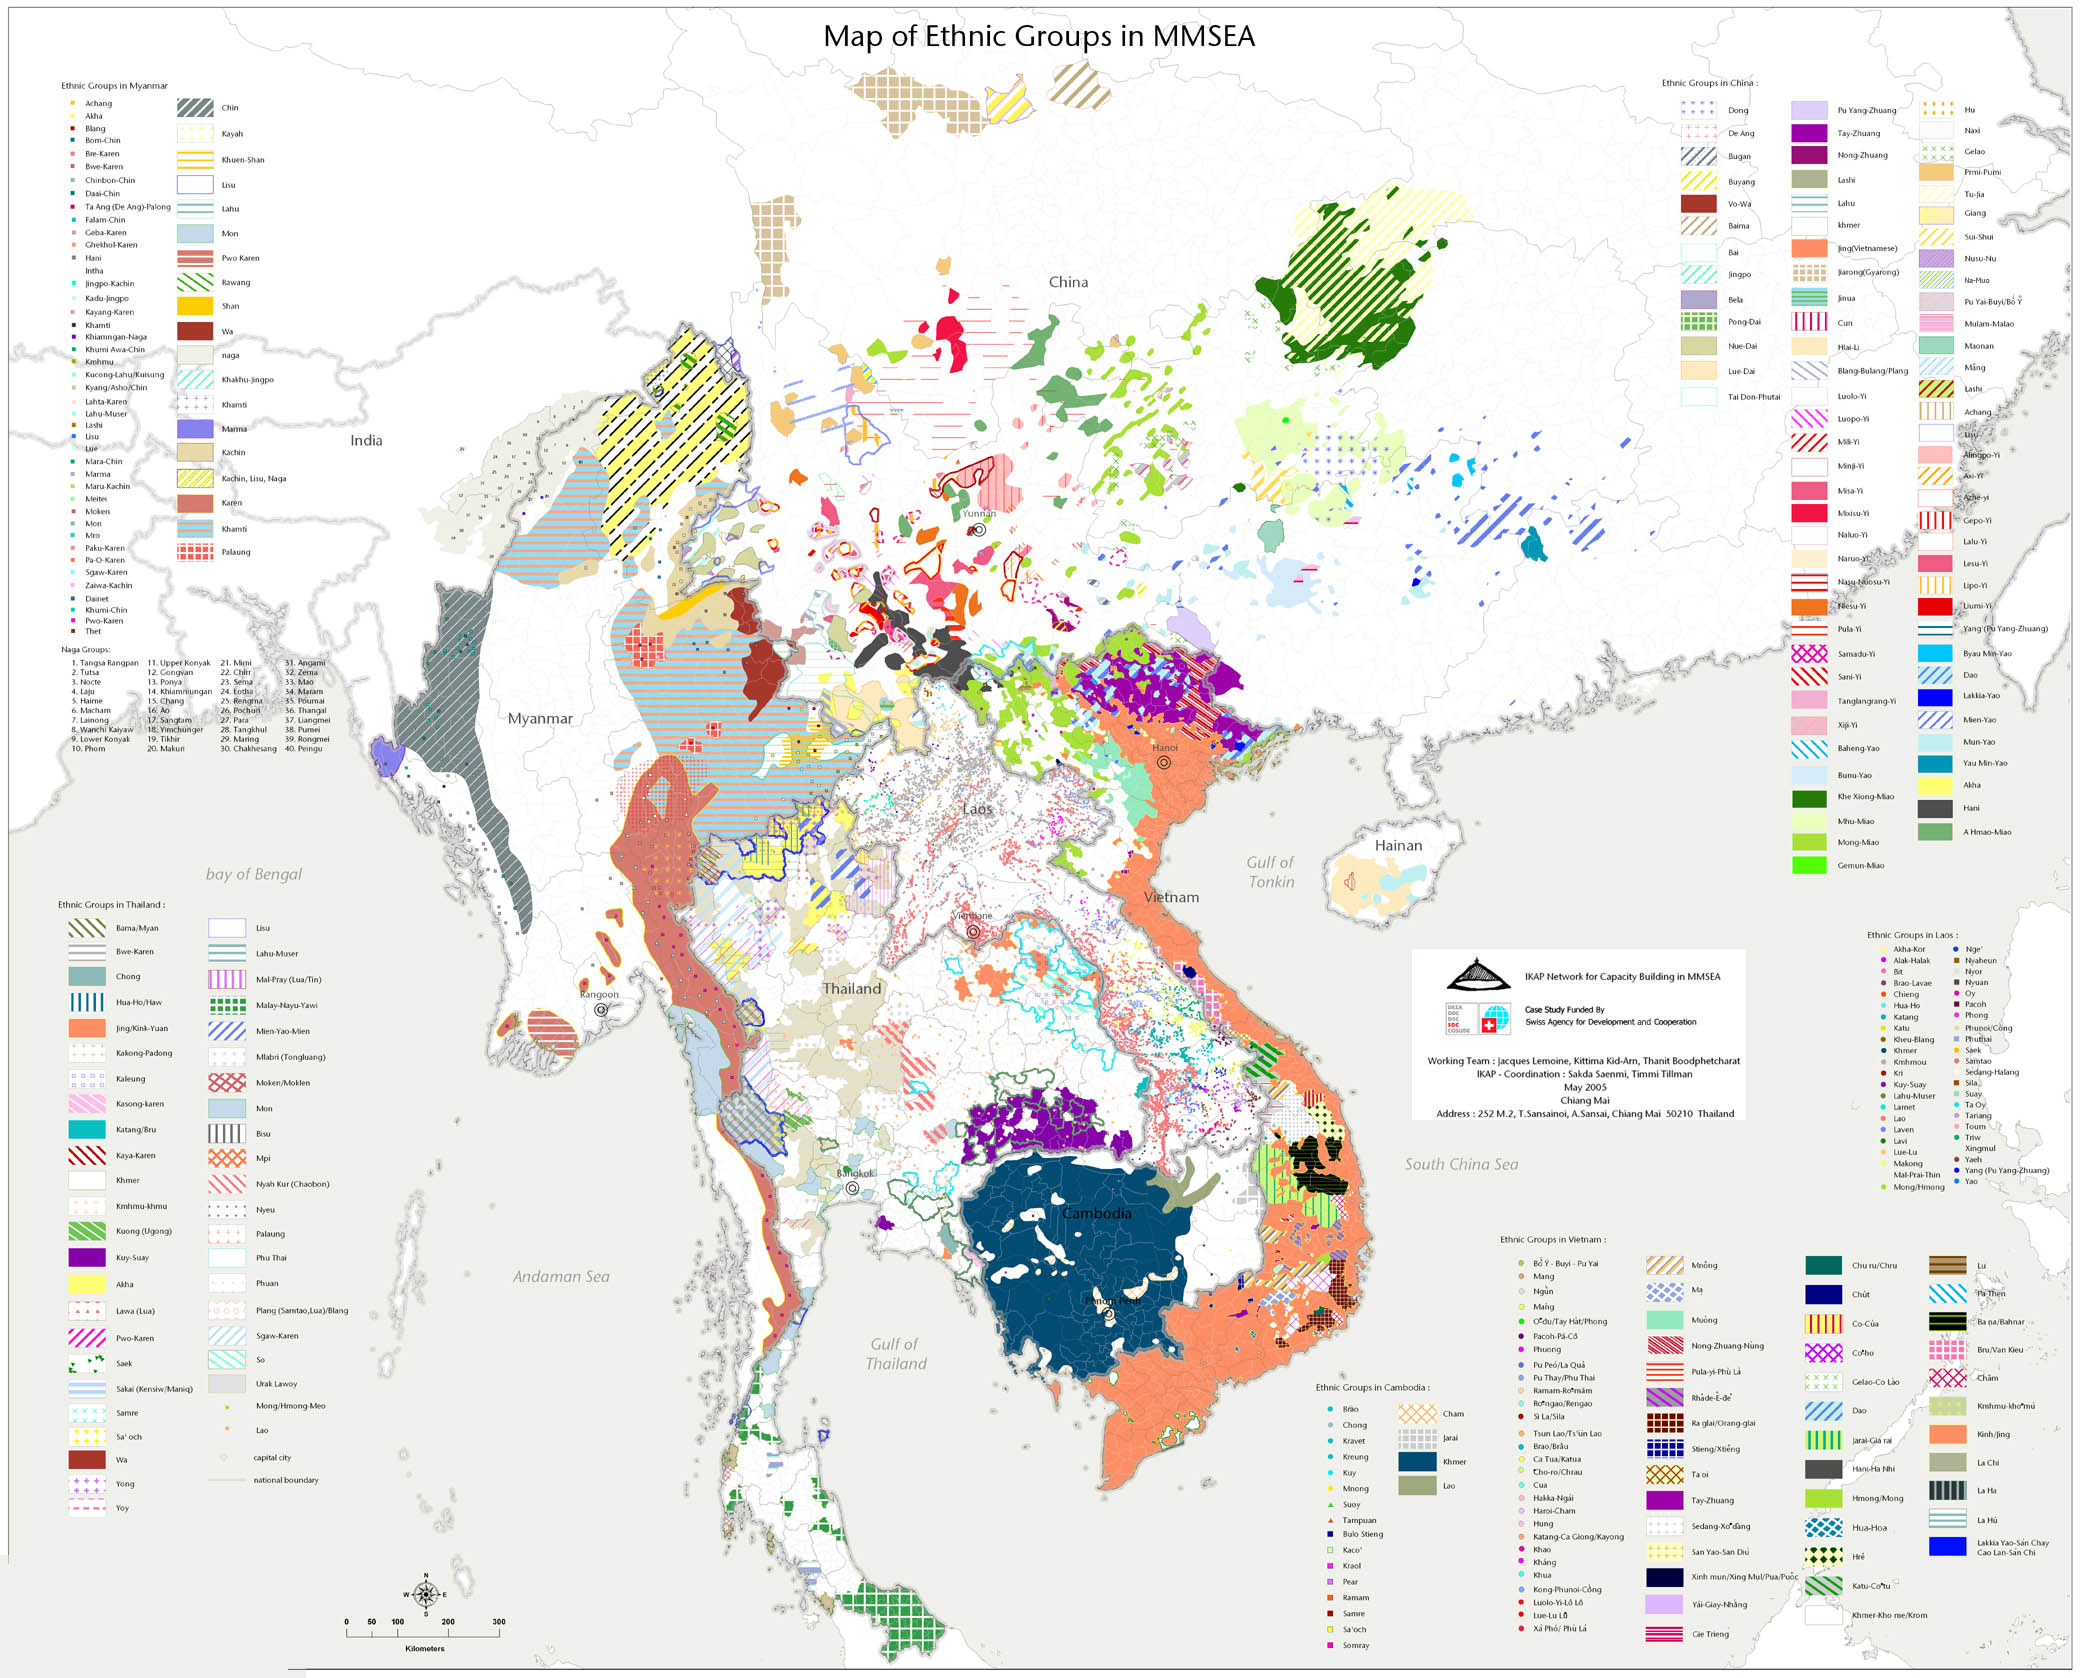
Japan is also socially cohesive. Its income inequality is relatively low (unlike the US, China, or Brazil, where income inequality is extremely high), and its unemployment rate is the lowest of any developed nation apart from Switzerland. Japan also possesses no major ethnic, linguistic, or religious divisions. An estimated 98 percent of Japan’s population is ethn0-linguistically Japanese, and, religiously, less than 2 percent is Christian. By comparison, Japan’s neighbour China is home to an estimated 23 million Muslims (mainly living in the country’s northwest), more than 100 million non-Muslim ethnic minorities (mainly in the southwest), 250-300 million native speakers of a variety of non-Mandarin Chinese languages (mainly in the southeast), and perhaps as many as 100 million evangelical Protestants.

Even Japan’s developed-economy competitors cannot compare to it in terms of internal unity. In the German economies, there has been a slowly (re)emerging commercial divide between eastern Germany, Austria, and Bavaria on the one hand and western Germany on the other, reflecting the fact that Eastern Europe has been growing quickly while Western Europe has been lodged in a seven-year economic funk. Within both France and Italy, meanwhile, northern regions have been growing while southern regions have been virtually in depression. And in Britain and Spain, secessionist movements like those of the Scots and Catalans have been growing in prominence of late.

Even in the United States there has been a growing divide between the Northeast and the South/West, a result of the fact that Texas alone has accounted for more than one-fifth of US economic growth since 2007, and that globalization and demographic shifts have had the effect of integrating states like Texas, California, and Florida more closely with Latin America than ever before, and states like California, Oregon, and Washington more closely to the rest of the Pacific world than ever before. (In Canada a similar trend has been occurring). All of these developed countries remain internally cohesive, of course; just not as potentially cohesive as Japan. Indeed, many of the above trends may be likely to continue in in the years ahead, which could make Japan’s internal unity even more distinctive.

Japan’s unique combination of economic size and internal unity may become increasingly significant during the years ahead, as it may allow the Japanese to throw their weight around in a world economy that, cliches of globalization notwithstanding, is in many ways still becoming rapidly smaller and smaller. The continuation of the Internet Revolution will probably be the most significant near-term driver of such globalization, but further leaps in conventional transport — by air, sea, or land — cannot be ruled out either. If rapid globalization does continue, and if large, internally cohesive economies like Japan are among its beneficiaries, economics may increasingly resemble Einstein’s actual theory of special relativity, with an economy’s mass beginning to directly correlate with its economic momentum.

Commercial Entanglement

Another characteristic that makes Japan special is its relative level of isolation from the rest of the global economy. According to the World Bank, the value of Japan’s international trade of goods and services is equal to just 30 percent of its GDP, a lower share than any other large developed economy apart from the US, and much lower than Japan’s most notable neighbours, China (50%), South Korea (103%), and Australia (41%). Indeed, many East Asian economies, such as Thailand, Vietnam, Malaysia, and Singapore, are among the most trade-dependent economies in the entire world. Japan, by comparison, is not only not dependent on trade in general, but is also not dependent on either imports or exports in particular.

What this means is that Japan might be able to manage a regional or global economic slowdown more easily than most other economies can. During the past few decades this ability has not mattered much, since global growth, and particularly East Asian growth, has been so formidable. Going forward, however, Japan may find itself able to manage persistently slower growth in places like China and Europe more easily than most other countries around the world will be able to.

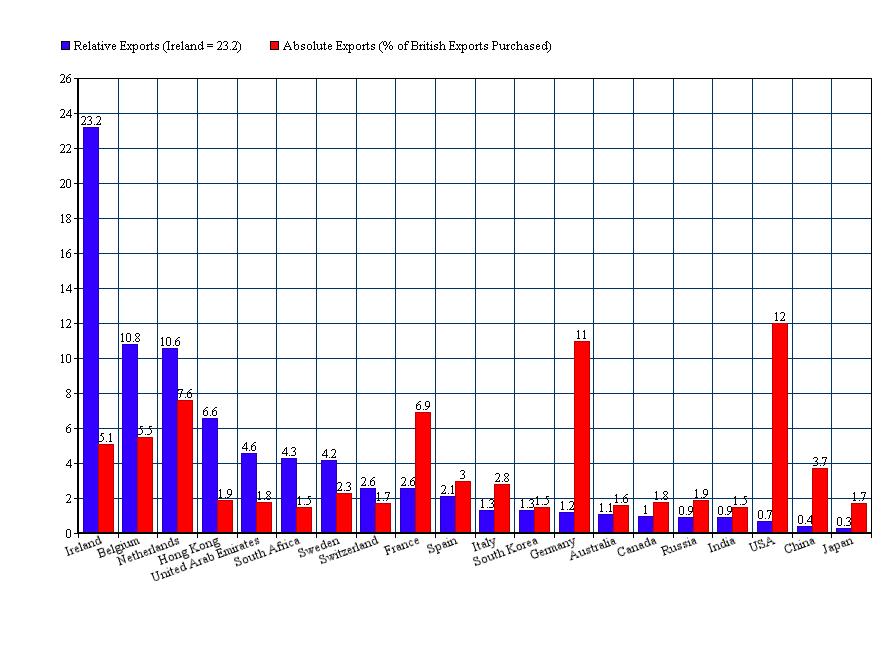
A slowdown in China, for instance, would hurt Japanese neighbours like South Korea, Taiwan, and Australia, countries in which 30-40 percent of exports go to China and exports in general are equal to 20-60 percent of GDP, far more than it would hurt Japan, which sends just 23 percent of its exports to China (including Hong Kong) and where exports in general are equal to just 15 percent of GDP. This ability to withstand external sluggishness could be a major advantage for Japan. It has certainly been helpful for the US, where a low dependence on exports is currently shielding the American economy from simultaneous recessions in most of Europe and Japan.

Crucially, even as Japan’s trade patterns might shield its economy from the full brunt of external crises, Japan also has the potential to benefit from becoming a more vigorous trading nation in the future. In the past, Japan’s ability to access global markets has been limited by its lack of proximity to the Atlantic world, where most of the globe’s economic and consumer activity is located. As a result, Japan is likely to benefit from the expansion of the Panama Canal, which is finally set to be completed in 2016, with significant consequences for inter-oceanic shipping. (In fact, arguably the most important consequence of the canal expansion is that it will allow 80% of LNG tankers to use it — currently none do — which will benefit Japan specifically, since Japan accounts for nearly 40% of the world’s LNG imports, and since, on the opposite side of the canal, Texas, Lousisiana, and Latin America may account for much of the world’s LNG export growth in the years ahead). Similarly, Japan could benefit from the continued growth of the East Asian and Indian consumer markets, as well as from more efficient cargo shipping worldwide, by air or by sea.

Finally, Japan might benefit from being able to use the Trans-Siberian railway to directly access European markets. This may finally occur because: a) the Russians increasingly need Japan as an ally because of their growing concerns with both China and the West; b) Russia’s rail network is becoming less crowded as a result of falling commodity prices and falling European demand for coal (since coal accounts for one-third of Russian rail freight, and commodities in general account for two-thirds of Russian rail freight); and c) because technology may make it cheaper and faster to maintain and operate railways and to load and unload cargo containers, which on the Japan-Russia-Europe route you expensively have to do twice: once at the seaports on Russia’s Pacific coast, and a second time in Eastern Europe because Russia’s and Europe’s rail networks use different gauges.

In addition to its foreign trade, Japan’s global investment position looks to be relatively strong. Japan has the highest NIIP in the world (NIIP = Net International Investment Position; basically, this is the amount of money a country’s government, businesses, and people are owed after you take into account the amount of money they owe to other countries). Though trustworthy, up-to-date NIIP statistics are notoriously difficult to come by (which is why people often focus instead on public and private debt-to-GDP ratios, which can be misleading because they only take into account a country’s foreign liabilities, while ignoring its foreign assets), as recently as 2010 Japan’s NIIP was estimated to be the same as those of China and Germany – which are the world’s next two largest creditor economies – combined. Indeed, while in America the media tends to obsess over Chinese ownership of US government debt, Japan owns just 3 percent of US debt less than mainland China does, and only 13 percent less than mainland China plus Hong Kong. Japan may have lots of assets with which it can potentially revive itself, in other words.

Energy Matters 

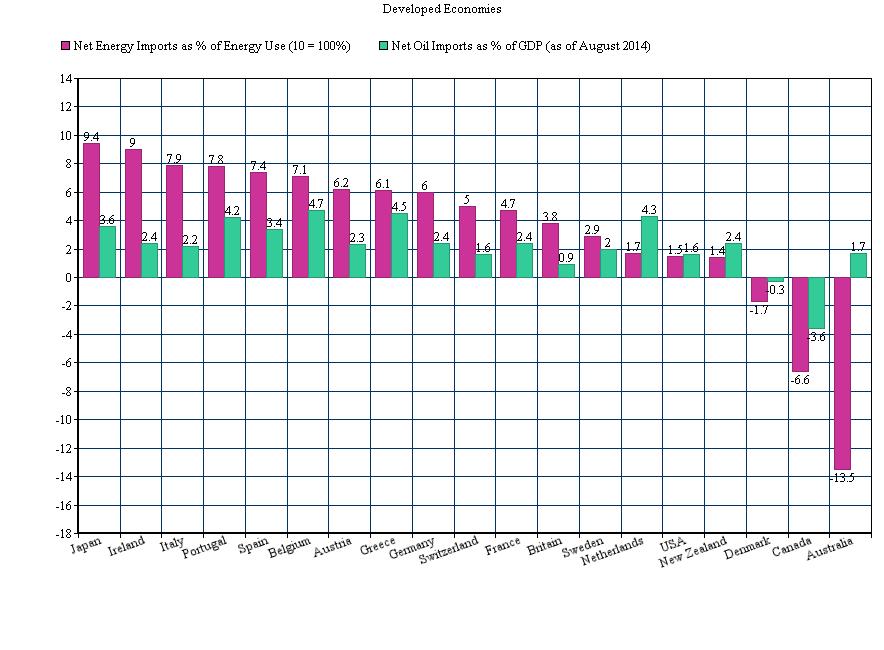
Does the inertia of a body depend upon its energy content? In economics, the answer to this famous question of Einstein’s appears to be yes. Developed countries in which energy imports account for a high share of GDP, such as Japan, Spain, Italy, Greece, and Portugal, have suffered some of the worst growth rates in recent years, when oil and gas prices have been very high. Developed economies that are major energy exporters, on the other hand, like Canada, Australia, and Norway, or that are relatively energy neutral, like the US, Sweden, or Denmark, have generally performed much better.

Developed Economies Energy and oil imports

With oil prices having reached a five-year low, falling by well over 50 percent since just the beginning of October, countries like Japan may now be better positioned for success than they have generally been in the recent years. In fact, it is not only lower energy prices that will have a positive impact on the Japanese economy, but lower prices for other commodities as well, which to varying extents are often correlated with energy prices. Japan, to be sure, is the world’s largest importer of tin, the second largest importer of iron ore, aluminum, copper, nickel, and silver, the largest food importer among developed economies, and by far the largest spender on coffee imports apart from the US.

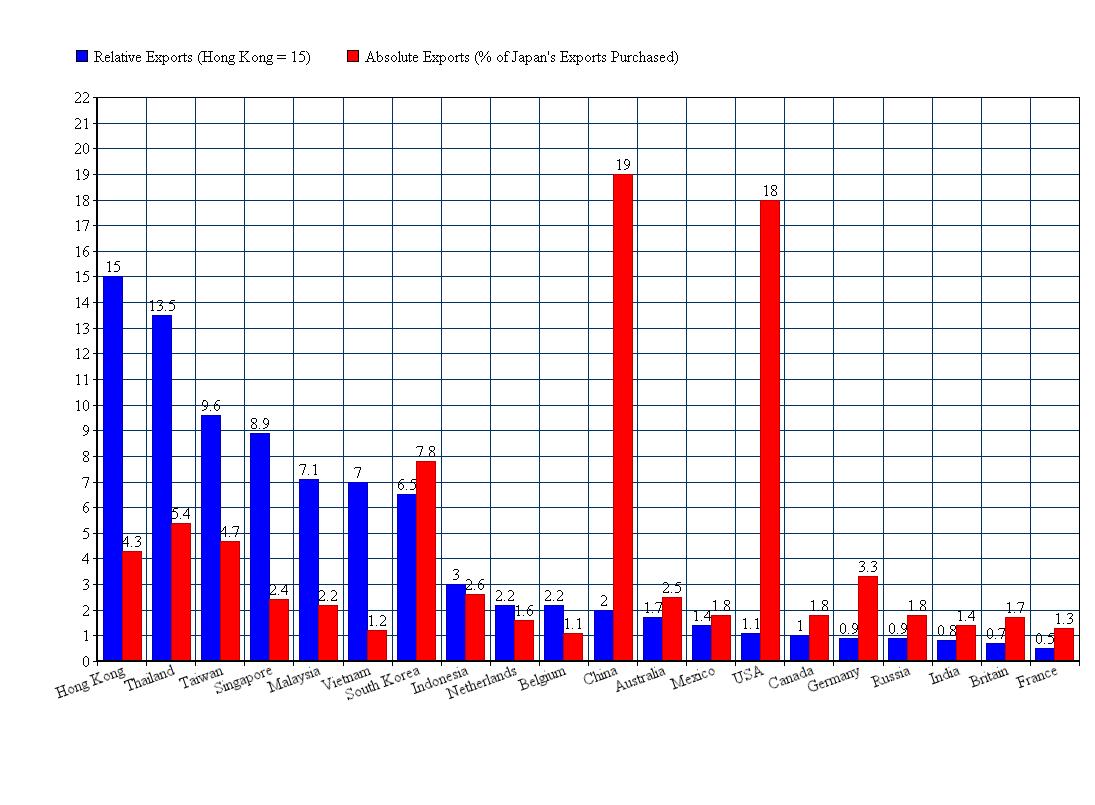
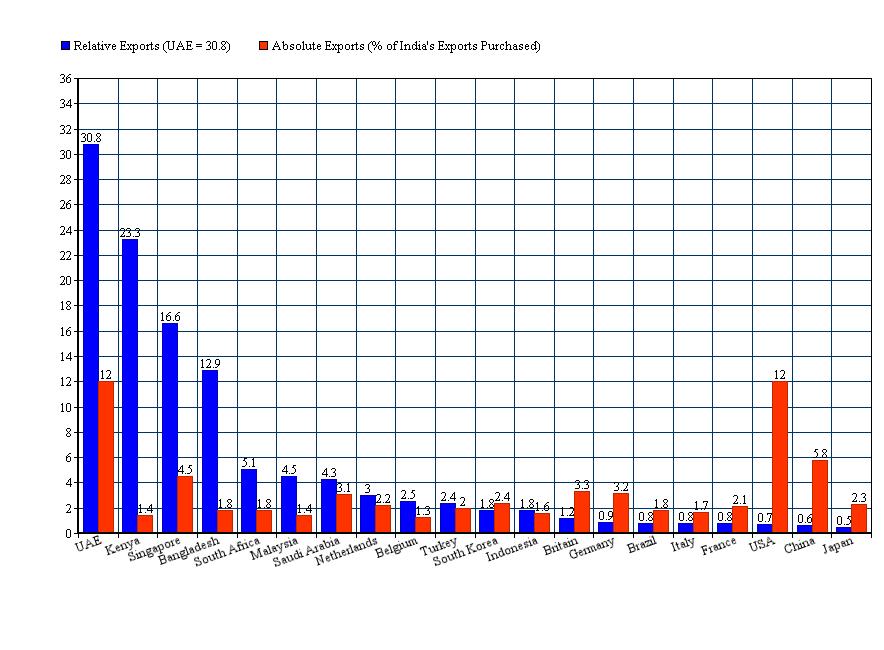
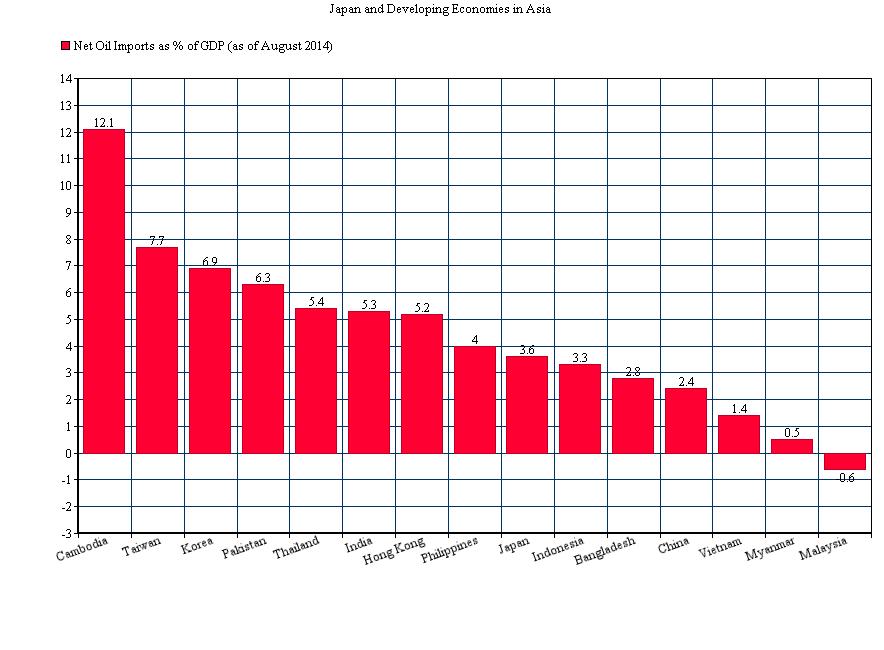
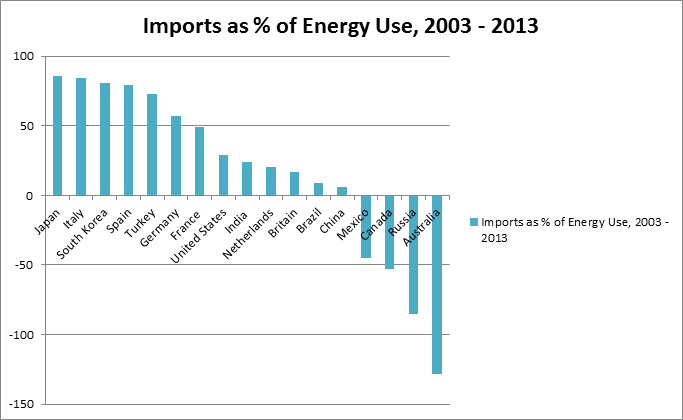
Of course, a developed, energy-efficient economy like Japan is not going to benefit nearly as much from falling energy prices as an energy-intensive, import-dependent emerging market like India, Pakistan, Thailand, the Philippines, or, on the wealthier side of the emerging market spectrum, South Korea or Taiwan (see graph). Even China, which only imports an estimated 13 percent of its energy (compared to 94 percent for Japan), will probably benefit much more from falling energy prices than Japan will, since the Chinese use about 5 times as much energy per dollar of GDP than the Japanese, are enormously dependent on importing commodities in general, and may be able to reduce some of their domestic pollution by replacing coal production with oil and gas imports.

20150123103628

But in this way too Japan stands to gain, relative to most other developed economies. This is because most of the main buyers of Japanese exports are energy-intensive emerging Asian economies, many of which are among the greatest beneficiaries of falling energy prices. Indeed, more than 40 percent of Japanese exports go just to China, South Korea, Thailand, or Taiwan, whereas no energy-exporting country receives more than 2.5 percent of Japan’s exports. In contrast, the US sends 25 percent of its exports to Mexico or Canada, both of which are substantial oil exporters. The Europeans, meanwhile, trade mainly among themselves, and include enormous energy exporters like Norway and Russia.

Japan is also in a unique position where alternative energy sources are concerned. It has far and away the most nuclear energy potential in the world, since it has the world’s third highest nuclear energy-generating capacity (virtually double that of fourth-place Russia), but has not been running any of its nuclear plants since the Fukushima incident in 2011 soured public support for them. Japan could, and might, turn many of them back on in a fairly short period of time.

Japan also has the fourth highest hydroelectric energy generation among developed countries (double that of fifth-place Spain), the third highest biomass/waste energy generation among developed countries (more than 50% higher than fourth-place Britain), the third highest geothermal energy production among developed countries, and the third highest solar energy generation of any country in the world (50% higher than fourth-place US). In addition, because of the growing possibility of using industrial machines to run manufacturing plants overnight, Japan may no longer be forced to waste much of the energy produced by hydroelectric, nuclear, geothermal, and wind, which unlike oil or gas cannot be shut off at night.

Finally, Japan may be able to get more commodities from Pacific Russia. First, as mentioned above, Russia is increasingly in need of allies outside of China or the West, and Japan is the obvious choice in this regard (South Korea is also an obvious choice, but South Korea is very closely embedded into the economies of both China and the West, and it is also much smaller than Japan). Second, as technology may continue to make resource-extraction much less dependent on labour, the commodity-producing potential of the Russian Far East could perhaps finally be realized in spite of the region’s tiny population of just around five million (less than one million of whom live in the gigantic territory to the north and east of Lake Baykal). Sakhalin island and the Kamchatka peninsula, both of which are relatively inhabited, rich in natural resources, and particularly accessible to Japanese influence, could be two interesting places to watch in this regard.

Russland_Relief

Demographic Entropy

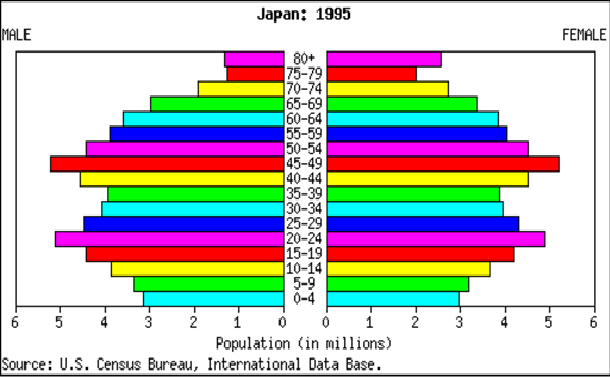
Analysts who are bearish on Japan ultimately tend to focus on one factor above all others: Japan’s aging population. This is certainly not an unreasonable concern; Japan’s population is the oldest in the entire world, with a large Baby Boom generation that is on the cusp of old age, a large Echo Boom population that is on the cusp of middle age, and a population of seniors (above 65 years old) that accounts for 26 percent of Japan’s total population, compared to only 14 percent in the US, 17-18 percent in Britain, France, and Spain, and 20 percent in Germany. This is, really, the main reason the Nikkei 225 index has been trading at prices that are just 13.9 times its earnings and just 1.3 times its “book value”, compared to a 19 price-to-earnings ratio and 2.8 price-to-book ratio for the S&P 500 in the US, or 15-19 price-to-earnings ratios and 1.8-2.1 price-to-book ratios in France, Britain, and Germany, where populations are more youthful.

While it would be unwise to ignore Japanese demographics, or try to spin them somehow as being an economic advantage rather than a disadvantage, it may nevertheless be useful to play devil’s advocate here for a bit, and explore the possible reasons why Japan’s aging population may not end up being even close to as bad for its economy as it is generally expected to be.

Reason 1: Japan’s retiring population means that it alone among countries in the developed world may not be negatively affect by the one-two punch of outsourcing and automation, which could rapidly lead to unemployment and income inequality crises in other countries. This could further increase Japan’s internal unity compared to other nations, giving it even more of an edge in terms of its economic “mass”.

Reason 2: Japan’s economy is not a closed system: it can decrease its demographic entropy by way of immigration. While it has become common for journalists to point out the fact that Japanese culture is not accustomed to dealing with immigration, the truth is that Japan has historically been able to adapt its mode of behaviour in very short periods of time, so it would not really be such a surprise if the Japanese were to begin bringing in lots of immigrants in the future, breaking with tradition. Certainly Japan’s high standard of living and proximity to Asia means that it can probably attract immigrants if it wants to. Japan has not needed immigrants in the past, but if and when it does, it may turn out that it doesn’t have such an affliction to them after all.

In fact, one way of looking at the fact that foreign-born individuals only account for an estimated 1.9 percent of Japan’s population (compared to 12 percent for Germany, France, and Britain, 14 percent for the US, 21 percent for Canada, and 28 percent for Australia) is that Japan still has a lot of room to increase the share of its total population that immigrants account for. Japan could actually bring in millions of immigrants and still have them account, for example, for less than one-fifth of its population, whereas a country like Germany or even the US would perhaps start feeling uncomfortable with immigration if immigrants were to make up more than a quarter or a half of their total populations.

Reason 3: Another way to look at Japan’s population of seniors is as the first wave in an enormous global demographic shift, with the aging populations of the developed world (particularly Europe and Canada) and the former Soviet Union only about a decade behind the Japanese, and with China not too far behind them. What this means is that many of the age-related issues that Japanese populations have already been dealing with for a while may now be coming to much of the rest of the world. This might actually help the Japanese economy, if it finds some of the goods and services it has been focusing on — among them robotics, health care, pharmaceuticals, and age-related consumer products — in demand from other countries.

In other words, Japan may be able to export some of its expertise and products to aging Western, Russian, Korean, and Chinese populations who are dealing with their own increases in age-related illnesses. In fact, because of the pollution in China, the coming decade may see an enormous increase in certain types of environment-related illnesses in China, even though China’s population is still somewhat younger than most Western populations. Many wealthier Chinese may even go to Japan to receive health care. The aging of China and the West is obviously not the happiest of prospects to contemplate, but it may nevertheless be something the Japanese economy is relatively well-positioned to benefit from.

Reason 4: Even if Japan’s aging population is a long-term problem, it may not be such a burden for its economy during the next decade or so. Japan’s Boomer population is only around 65-70 today, and is still extraordinarily healthy for its age. Because of the Internet, Japanese seniors  may also be able to keep their productivity and consumption up more than people of the same age have historically been able to do. Japan’s Echo Boomers, meanwhile, are still just around 40-45 years old. Because Japanese have so few children (13 percent of Japan’s population is below the age of 15, compared to 19 percent for the US, Britain, France, and Australia), they have more time and money to spend on other things, whether work-related or leisure, which can be economically stimulative. Spending time and money on children may be great for an economy over the long term, but in the short term it can arguably hold an economy back.

Alternate Dimensions 

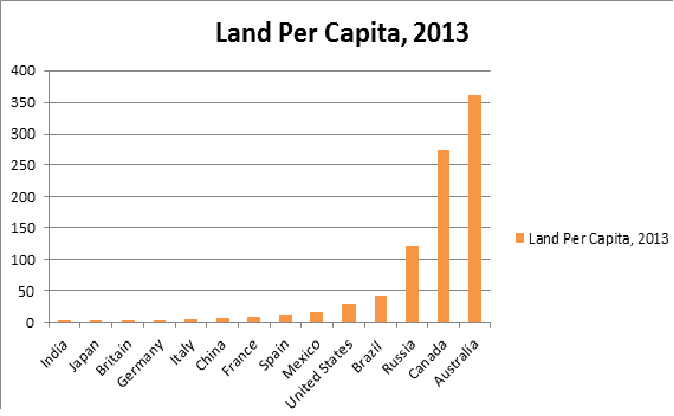
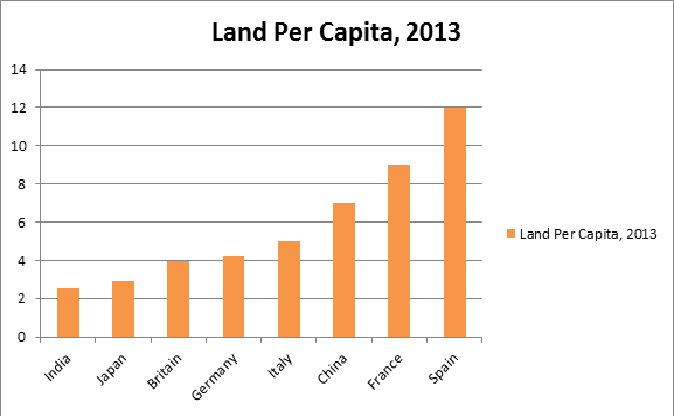
Economists have historically tended to view wealth as being derived from a combination of three “inputs”: capital, labour, and land. Japan is very well endowed in the capital and labour departments, but it has been held back to a certain extent by its scarcity of land. Excluding mountainous regions, which constitute an estimated 75 percent of Japanese territory, Japan is only about the size of Michigan. Even including its mountains, Japan’s population density is 1.5 times higher than Germany’s and ten times higher than in the US. Among significant economies, only India, South Korea, and the Netherlands are more densely populated than Japan (and none of them by much).

Japan has paid a steep price for its density: according to the Economist, between 1980 and 2000 Japanese property prices were consistently the highest in the world, both in real terms and in relation to average income levels. Japan’s lower property prices today are simply a reflection of its slow pace of population and economic growth; if the economy of Japan is to rebound, it will need to find a way to make due without much physical space. Indeed, even today, following two decades of deflation, Tokyo is the fifth most expensive city in the developed world and the eighth most expensive city in the entire world to buy an apartment in.

Can technology finally allow Japan to overcome its lack of space? To a certain degree the answer may be yes. Japan’s vast multitude of mountain valleys, for instance, are no longer nearly as isolated as they were even just five years ago. Today, with the modern Internet, their inhabitants can access national markets and social networks, and can increasingly bargain collectively for goods and services. Over the next decade they may become even less isolated, as technology is likely to sharply reduce traffic on the country’s crowded road network (which will also free up plenty of room in Japan’s large cities), gasoline prices may remain lower than they have been in recent years, and elderly and retired Japanese may travel less frequently than Japanese populations have done in the past.

Japan’s mountain regions may also be aided by technologies like the Aeroscraft, an airship the length of a football field that is currently being developed in the US as a response to the difficulties its military has faced in mountainous landlocked Afghanistan. The Aeroscraft could allow non-bulk goods to be shipped efficiently in mountain valleys where there is not enough cheap land available for significant airports, and where the need to take-off and land in each individual valley makes ordinary airplanes (which have extremely high take-off costs) highly inefficient. While it is impossible to know for sure, it seems possible that Aersocraft airships will be ready for regular use within five to ten years. In addition to helping Japan’s mountainous territories better participate in the Japanese economy, they could potentially also help Japan access markets in nearby economies like South Korea and northern China more quickly than can be done by ship.

Another way to overcome a lack of conventional space is to construct high-rise apartment buildings. Japanese cities have already done this, of course, yet they have been somewhat limited in their efforts to do so by the high cost of construction. Going forward, however, such costs may decline. As Japanese workers retire en masse, for example, and as many white-collar jobs in Japan begin to be automated or outsourced while more work can be done from home offices because of the Internet, Japan is likely to see a large number of its commercial high-rises transformed into residential buildings. While this transformation is not inexpensive, it can be done at a tiny fraction of the price of building a high-rise from scratch.

In addition, if commodity prices remain low, and if China’s enormous construction frenzy finally ends, Japan will find it much cheaper to import building materials. It might even be able to import some skilled Chinese engineers, or Chinese-built apartment modules. Indeed, modular construction might might significantly reduce both the costs and the required labour and time of high-rise construction. This could be a huge help for a country as incredibly compact and mountainous as Japan.

In Search of a Unified Theory 

How will Japan’s real estate, demographic, commodity, commercial, sociopolitical, and income factors combine in the years ahead? It is not clear. What is clear, though, is that ignoring Japanese stocks remains something that cannot be done lightly. Japan’s economy continues to have Potential. With the Nikkei still relatively cheap on a price-to-earnings and price-to-book basis, then, it is not surprising that the recession has not led to a market drop. The cat may yet be alive.
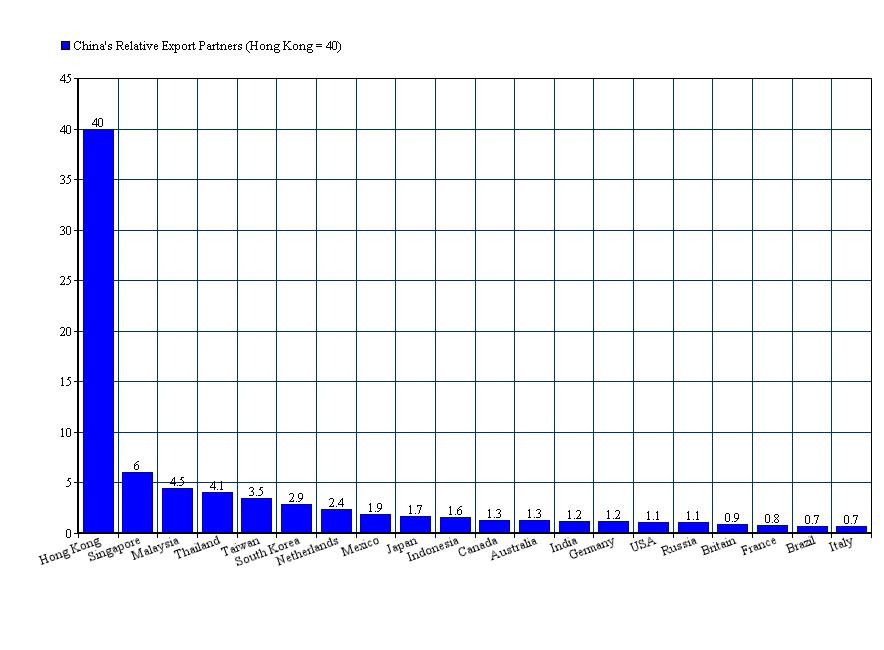
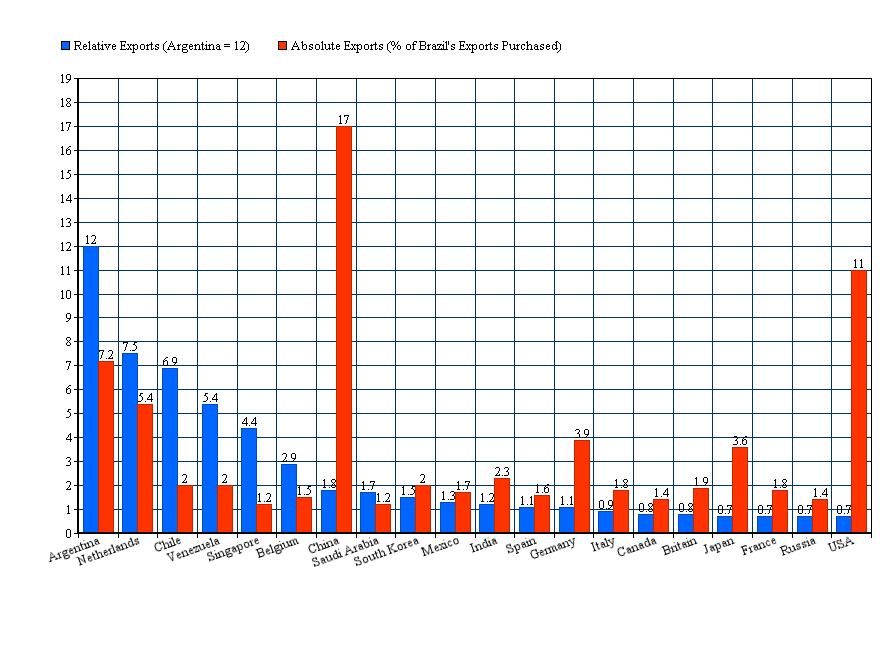
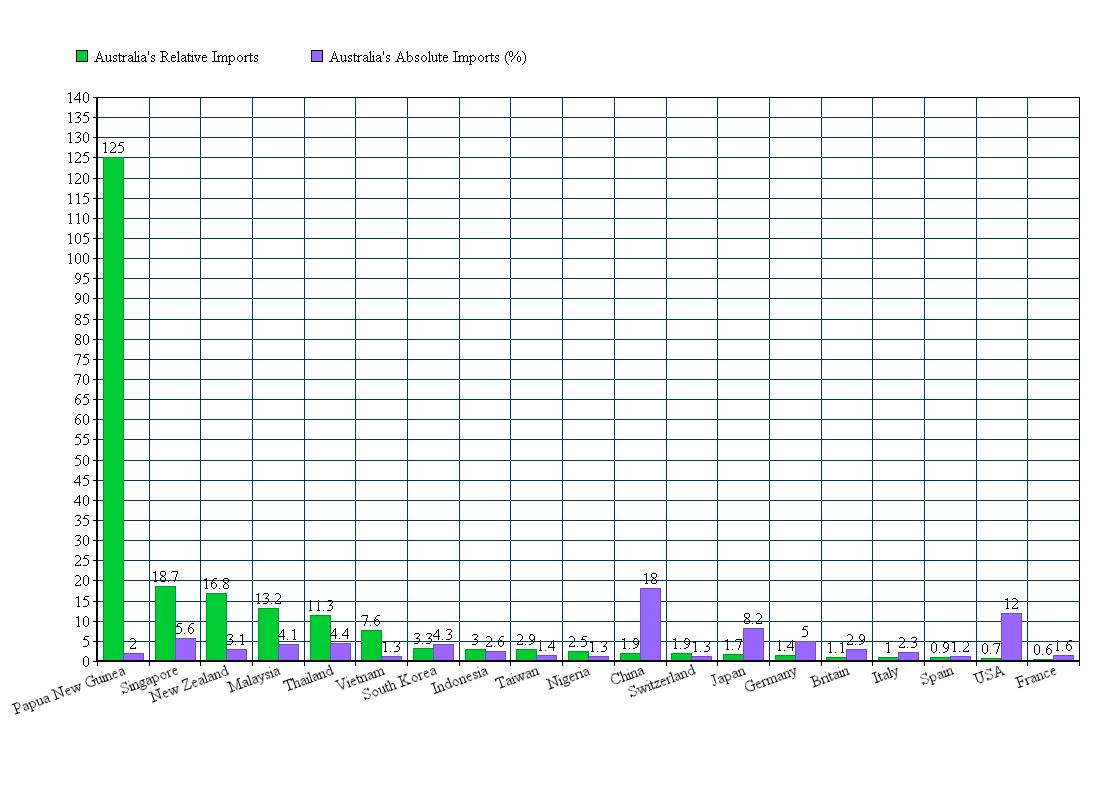
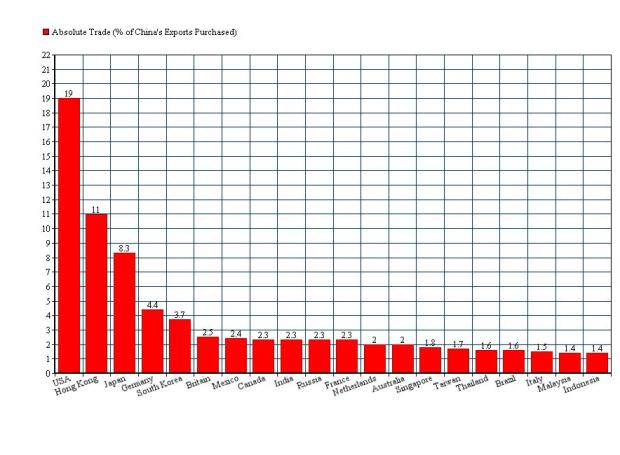
Japan from 1995 to 2035

The graph below shows the world’s 20 largest economies, and how many times larger they are today than they were in 1995. As you can see, Japan grew the slowest of the countries on the list. Though it is still the world’s third largest economy, close to double the size of fourth-place Germany and more than half as large as second-place China, its economy is barely larger than it was in 1995. During that same span, China’s economy is believed to have grown more than twelve-fold.

gdp


How did this happen?

Japan was all over America’s radar in the early 1990’s. As you can see from the graph below, Japan’s gdp is thought to have been 66% as large as the US’s in 1994. By comparison, even China’s gdp today is only thought to be 52% of the US’s. At the same time, there were no other obvious candidates to attract American attention back in the 1990s; Germany was inwardly focused on reabsorbing East Germany, while China’s economy was only the 10th largest in the world and Russia was in its post-Cold War disarray.

gdp 4


Many Americans at the time worried that Japanese businesses were out-competing their own, and as a result called on their government to reduce some of the benefits that the United States had provided Japan during the Cold War. This attention was probably not the best thing for Japan; indeed, it may not be a complete coincidence that the Japanese stock and real estate markets collapsed during 1990, the year after the Berlin Wall came down.

The most famous “Japanophobic” film: Rising Sun (1993), starring Wesley Snipes and Sean Connery


Japan’s gdp per capita in 1995 was 1.4 times higher than the United States, the next richest major economy. It was 4 times that of neighbouring South Korea. Having such a nominally wealthy population may have made it difficult for Japan to compete with other developed countries, much less with developing ones.

gdp 4

Most of Japan’s baby boom generation reached the age of 50 in the late 1990’s, and began saving more for their eventual retirement.  This meant that there was less private consumption to stimulate Japanese gdp.  By comparison, the boomers in the US and Europe in 1995 were only in their mid-30’s, and in China they were in their mid-20’s. Japan’s second largest generation, meanwhile, was entering their mid-to-late 20’s during the 1990’s, meaning that Japan’s labour force was not growing at the same speed as it had through the 1980’s when this generation was graduating from high school and college.

gdp 4

Between 1997 and 2007 the price of energy shot way up, reaching all-time monthly highs even when adjusted for inflation. Despite dipping somewhat during the recession in 2008, prices have stayed very high by historical standards during the past five years. Japan, though it uses its energy more efficiently than most countries, is also one of the most dependent upon imports for its energy consumption. As a result, the high prices of the past decade have helped limit its economy’s ability to grow.

gdp 4

gdp 4

Japan is not only dependent on importing energy, but also most other natural resources. It is the world’s largest importer of tin, and the second largest importer of iron ore, copper, aluminum, nickel, silver, and coffee. Using land as a (admittedly limited) proxy for natural resource wealth, the graph below shows how Japan compares poorly with other major economies on a per capita basis.

gdp 4

And zooming in on this graph:

gdp 4

Japan’s small amount of land and resources relative to the size of its population probably played a role in its poor economic performance in the past two decades, as this period saw global mineral and food prices rise rapidly.

Finally, Japan is one of the most equal countries in the world in terms of income distribution, and has one of the lowest unemployment rates. Arguably, Japan’s gdp grew less than it could have because the country was more focused on pursuing social welfare goals like employment and income equality.


What’s next for Japan?

Obviously, Japan is no longer attracting too much American attention: that honour now goes to China. Japan’s development costs may also no longer so much higher than those of other developed countries.  Japan now has a per capita gdp that is around 87% as high as Germany’s and France’s, 74% as high as that of the United States’ and Canada’s, and just 59% as high as Australia’s.

However, Japan’s population is still the oldest in the world, and it is older than ever. Japan’s baby boomers are now 65 – 70 years old on average; given that the average effective age of retirement in Japan is 69, they may soon retire en masse. Meanwhile, the second largest generation in Japan today is 40 – 45 years old on average, meaning that their levels of consumption may decline as they enter their 50’s and 60’s over the next fifteen years. It is perhaps worth mentioning here that not only did Japan’s financial crash in the early 1990’s occurred when its baby boomers were approaching age 50, but that the US and Europe’s crises of 2007-2008 occurred as American and European baby boomers were approaching age 50.

Fortunately, Japan does have the highest NIIP in the world. (NIIP = Net International Investment Position; which is basically the amount of money a country’s government, businesses, and people are owed after you take into account the amount of money they owe to other countries). In fact, as recently as 2010, Japan’s NIIP was roughly that of China and Germany, the world’s next two largest creditors, combined. Japan also has the highest life expectancy of any country in the world, at 84.6 years – compared, for example, to 80 for the US. And Japan is also frequently listed as having the highest standard of life among major economies, if such ratings are to be believed.

That being said, Japan’s population is aging so rapidly that it is not clear whether either of these things will be sufficient to allow it to remain economically competitive in the years ahead.  In addition, the huge amount of money that Japan is owed by other countries can only be used if those countries are able to pay it back; something that does not always happen so easily, as Germany has learnt in recent years. To be fair, much of the money owed to Japan is invested in the United States, which is unlikely to turn into Greece anytime soon. Still, you can never be too sure.

Japan also continues to be highly dependent on imports for its energy consumption, particularly since the tsunami-induced nuclear meltdown it experienced in 2011. 95 percent of Japanese energy comes from imported fuels, compared to only 15 percent for the US and 10 percent for China. Japanese electricity prices are more than double those of the United States, and higher than all major European countries apart from Germany. This could make it relatively difficult for Japan to use machines to help supplement its aging workforce.

One obvious way to deal with an aging population is through immigration. This is not, however, something that Japan is accustomed to doing.  Japan has one of the smallest foreign-born populations in the developed world. Moreover, unlike English, Spanish, Portuguese, and French, there are no large and poor populations in the world who speak Japanese that Japan can recruit. The Japanese diaspora is only about 2.5 million strong, 1.2 million of which live in the US and probably aren’t looking to move to Japan, and 1.5 million of which live in Brazil, which is about as a far away from Japan as you can get. Some countries, like Sweden, Denmark, and the Netherlands, deal with a similar problem by using English to speak to some of their immigrants. However, Japan is also the worst at speaking English among nearly all developed countries in the world. Plus, Japan’s population density is also still extremely high, so the country may have an especially difficult time growing its population further through immigration.

Of course, none of this means that Japan will definitely not open its doors to mass immigration – it has a high standard of living to attract prospective immigrants, and it has historically proven that it can undergo dramatic cultural and economic changes in a very short period of time. That being said, Japan will probably find it many times harder to solve its demographic problems through immigration than, for example, Canada will when it eventually faces the same kind of rapid aging that Japan is on the verge of.

If immigration and automation cannot get the job done in the short time frame Japan faces before its population reaches old age, this might only leave outsourcing as a solution to its demographic problems. There are 1.3 billion Chinese people living within a relatively short distance of Japan that it could potentially outsource to. However, Japan is unlikely to rely on China for too much of its outsourcing needs, for five reasons.

First, Japan is unlikely to decide to become too dependent on China given that it knows China might become powerful enough to dominate it at some point in the future.Second, China still resents Japan for its brutal occupation of much of its territory during the 1930’s and 1940’s. Third, Japan is already extremely dependent on China; 26% of Japanese imports came from China in 2013, compared to only 11% from Japan’s next largest trade partner, the United States. No country wants to be too dependent on any other single country, so Japan will not want its dependence on China to increase much more than it already is.

Fourth, Japan does not want to be too dependent on China because the Chinese economy is potentially unstable, having become accustomed to rapid growth that may now be unsustainable. Finally, Japan will not outsource too much to China because Chinese labour is no longer so cheap to employ. China’s average income is now $6000, and in coastal provinces that Japan can access most easily it averages around $10,000. By comparison, average incomes in nearby Vietnam are only $1700, Cambodia $950, Indonesia $3600, the Philippines $2600, North Korea $1200, India $1500, and Bangladesh and Burma $900.

Thus, Japan will probably look to Southeast Asia or even India for most of its future outsourcing needs. This could help it to overcome its demographic challenges, while also serving as a boon for the poor countries receiving Japanese investment. However, it will also mean that Japan will have to be increasingly active in regional affairs, driving hard bargains when it comes to crafting economic agreements with the countries and businesses it outsources to. In addition, Japan will continue to rely heavily on Southeast Asia, the Middle East, and/or Pacific Russia for its energy and mineral needs for at least the foreseeable future. As a result, Japan could once again become an extremely active player throughout much of Asia, looking to gain access to both cheap labour and natural resources.

How might this affect its relations with other regional powers, particularly China and the United States but also South Korea, Australia, Thailand, Indonesia, India, Taiwan, and Russia? Will Japan be able to maintain healthy relationships with all of these states, or will it be tempted to move closer to some and further away from others? And can Japan’s economy come through its demographic changes intact, perhaps even serving as a model for other Western countries whose own Boomers will reach their seventies during the 2020s and 2030s? We will find out soon enough.

China’s North-South Split

It would be impossible to understand the United States without knowing a bit about the differences between northeastern states like Massachusetts and southeastern states like Mississippi. To an even greater extent, a similar thing can be said of China. There are many things that make northeastern and southeastern China very different from one another. Now that China has become the second largest economy in the world, it is probably important that we learn some basic facts about these differences.

Let’s start with the geographic differences first, before moving on to economics and politics:

Topography      

Topographic-map-of-China-2005

As you can see from the map above, northeastern China contains two large plains, one located immediately to the west of the Pacific Ocean and one  immediately north of the Pacific Ocean. In contrast, southern China is comprised almost entirely of hills and mountains, which in most places extend as close as 1-50 km to the Pacific. This picture below of the southeastern city of Hong Kong, for instance, shows that much of its population lives in high-rise apartments that are sandwiched between mountains and the sea.

5241-hongkong

Rainfall

aa

Southeastern China receives roughly three times as much rainfall as  the coastal areas of northeastern China, and between three and twenty times as much rainfall as areas within a few hundred km inland of the coast of northeastern China.

Forests       

aaaa

Southeastern China is covered in many places by forests, whereas northeastern China, with the exception of the areas near the border with North Korea  and Russia (which are home to only around 15 million people), is not.

Agriculture     

aaaaaa

In spite of China’s rapid industrialization, the country still relies on agriculture for around 10% of its economic output and 37% of its employment. As you can see from the map above, southeastern China primarily produces rice and tea, while northeastern China produces wheat, corn, millet, sorghum, cotton, and soybeans.

Pollution 

aaaaaaa

aaaaaaaaa

Northeastern China, in part because it is where most of the country’s coal is produced, is generally much more polluted than southeastern China.

Language  

aaaaaaaaa

Languages and dialects are always complicated to pin down, making graphs that depict them over-simplistic in most cases. That being said, it is probably not a stretch to say that China’s regional linguistic divisions are in many cases quite substantial. Speakers of a southern Chinese dialect would not necessarily be able to converse with speakers of a northern one, for example. The map above shows that southeastern China has much more linguistic diversity than northeastern China, and less of a linguistic connection with China as a whole. The map also shows that the southeastern province of Fujian shares a linguistic connection with neighbouring Taiwan.

Ethnic Minorities     

aaaaaaaaaaaaaa

(Note: just because a place is coloured in on this map, does not mean that it is majority non-Chinese, but only that it is home to a relatively large concentration of non-Chinese. In fact,  as of 2000,  only the far western provinces of Xinjiang and Tibet were thought to be majority non-Chinese).

The map above does not show this, but the ethnic minorities in southeastern China have a combined population that is approximately four times larger than those of northeastern China. There is also much more ethnic diversity in southeastern China, as the map does show.

Population Density      

aaaaaaaaaaaaaa

(Keep in mind that this is China: even the orange areas of this map have population densities greater than that of the United States).

This map reveals several differences between northeastern and southeastern China. First, it shows that northeastern China’s population density is generally much higher than southeastern China’s. Second, it shows that northeastern China’s population is clustered together, whereas southeastern China’s is spread out relatively thinly in enclaves along its Pacific coast. Third, it shows that northeastern China’s highest density areas are located a few hundred km inland, while southeastern China’s high density areas are beside the sea.

Here’s a slightly more detailed map of China’s population density, which really shows this northeast-southeast difference:

China_density-pop

Politics      

Hong Kong, one of the largest cities in southern China and one of China’s two major financial centres, was a British territory until the late 1990’s. Taiwan, an island 180 km off the coast of southeastern China, has effectively been independent since the mid-twentieth century.

Today, of the 43 members of the three leading political offices in China (the Politburo of the Communist Party of China, the Secretariat of the Communist Party, and the Central Military Commission), only two were born in southern China. Of the Politburo Standing Committee (the seven-man group which is generally considered to be the top leadership of China), only one person – who is the lowest-ranked of the seven – was born in southern China. And not one person in any of those groups was born in the southern province of Guangdong, which neighbours Hong Kong and is China’s largest province both by population size and  economic output. Finally, nobody born in Southeastern China or Southwestern China has ever become the ruling General Secretary of the  Communist Party of China or the Premier of the People’s Republic of China.

History   

This interactive map of Chinese history – http://www.timemaps.com/history/china-1500bc – describes some of the historical fault lines between northern and southern China; for example, during the 6th and 13th centuries AD and prior to the 3rd century BC.

Also not shown in this map are the different experiences northern and southern China went through when confronted with foreign powers in the 19th century. To give a simplified summary of what happened during that era, parts of southern and central China were roughly divided into Japanese, British, and French spheres of influence (with Germany, the US, and other European states also influential in certain areas), whereas northern China was by comparison left as a relatively independent state.

During the Xinhai Revolution which overthrew the last emperor of China just prior to WW1, meanwhile, it was the southern provinces where most of the earliest and most influential rebellions took place. In fact, the critical diplomatic moment of that revolution was at an international conference called the North-South Conference. Later, the Northern Expedition from 1926 – 1928 was one of the largest military campaigns in China in the first half of the twentieth century, and it reflected north-south divisions within China as well.

In the decades after that, a number of southern Chinese provinces would also play arguably the most important role in the original rising of the Communists in China against the ruling Nationalists, during the Chinese Civil War from 1927 – 1950. Finally, when the tables turned against the Nationalists in the civil war, they fled to the southeastern Chinese island of Taiwan, where they continue to govern today. Taiwan has become one of the 25 largest economies in the world, and it has particularly close commercial and social ties to mainland China’s southeastern provinces.

Economics

If you visit this interactive webpage that the Economist magazine has made – http://www.economist.com/content/chinese_equivalents – you can see a number of interesting things. First, that Hong Kong, in southeastern China, has a per capita gdp that is far higher than that of any other significant Chinese city; more than double those of Beijing or Shanghai, six times the national average, and more than 11 times that of China’s poorest province. Second, that apart from coastal areas like Guangdong, Fujian, and the city of Hong Kong, southeastern China is actually the poorest area in China, home to four of the five poorest provinces. And yet, the coastal provinces of southeastern China are for the most part just as rich as the coastal provinces of northeastern China. In fact, Taiwan, which lies off the coast of southeastern China and speaks a southeastern Chinese dialect, has a per capita income that is between 3 – 10 times greater than those of China’s provinces.

Finally, you can see that the coastal areas of southeastern and central-eastern China are much, much more dependent upon exports than other parts of China are.

Religion 

Parts of Southeastern China in recent years seem to have joined Hong Kong in becoming one of the main centres of China’s potentially enormous transition toward Christianity. Today, according to the Economist, arguably more than 100 million people in China are Christian, up from perhaps as few as 15 million as recently as the 1990’s. If these numbers are accurate, then the growth of Christianity within China during the past two decades represents one of the largest religious adoptions in all of human history. Hong Kong has long had a significant Christian population, meanwhile, and remains around 10-15 percent Christian today. A number of the Hong Kong protest organizers were practicing Christians, in fact. And, notably, the Chinese government may have begun to crack down on parts of this growing Christian religion within China during the past year or so.

Energy 

The vast majority of Chinese energy production is located in the north, in provinces like Shanxi and Inner Mongolia, which produce nearly all of China’s coal (and coal accounts for about 70% of Chinese energy use), and in provinces like Xinjiang and Heilongjiang, and Liaoning, which produce nearly all of China’s oil (and China is the world’s 5th largest oil producer).

Northern China also accounts for most of China’s natural gas production (7th largest in the world), natural gas imports (which come overland from Central Asia; China is the world’s 10th largest gas importer), and recoverable shale gas reserves (thought to be the world’s largest). Northern China also directly borders and has a relatively close relationship with North Korea, which has the world’s 17th highest production of coal and 2nd highest production of anthracite coal (which is the most desirable type of coal, though it only accounts for an estimated 1 percent of global coal reserves).

Southeastern and central-eastern China, in contrast, accounts for most of China’s oil imports from other countries (and China is the world’s 2nd largest oil importer), most of China’s liquified natural gas imports (5th largest in the world), most of China’s nuclear power production (5th largest in the world), most of China’s hydroelectric power (by far the largest in the world), and, in the southwestern province of Tibet, the most potential hydroelectric power in the world.

Military    

http://ytilaerniereh.files.wordpress.com/2010/08/china_ground_force_units_2008.jpg

According to the map above, which was made by the US Department of Defense, of the 19 major ground force units of China’s People’s Liberation Army, 6 of the 9 not to have primary missions that are defensive are the 6 that are located the furthest in southeast.  5 of the 6 that have amphibious primary missions are located in the southeast. 4 of the 5 to have mobile units are located in northern China. A 2012 Pentagon report also claims that “consistent with a near-term focus on Taiwan Strait contingencies, China bases many of its most advanced systems in the military regions opposite Taiwan”, in southeastern China.

the PIPEs are Calling

 After accounting for more than a third of the world’s economic growth since 2003, the BRIC economies – Brazil, Russia, India, and China – are likely to slow in the decade ahead. Here are six reasons why that is:

1.      Higher Incomes 

According to the World Bank, average incomes have reached $7000 in China, $11,000 in Brazil, and $14,000 in Russia. Unlike a decade ago, when Chinese average incomes were still around $1000 and Russian and Brazilian incomes $3000, today only India, with an average income of less than $1500, remains competitive with most other developing nations in being able to supply cheap labour, goods, and services.

2.      Aging Populations

China and Russia have populations that are aging rapidly relative to the majority of developing economies. 12% of Chinese and 18% of Russians are over the age of 60, compared to just 7.5% of people in the Indian Subcontinent, Southeast Asia, Latin America, and the Middle East, and 5% of people in Sub-Saharan Africa. China’s most populous generation is currently 40 – 50 years old, and Russia’s is 50-65 years old. By  contrast, in most other developing economies the largest generation is somewhere between 0-35 years old.

3.      Dependence on Coal

China, India, and Russia are three of the world’s four largest consumers of coal and emitters of carbon dioxide. China derives 70% of its energy from coal, almost double that of any other country. India derives 40-50% of its energy from coal, a greater share than any country apart from China or South Africa.  This makes these countries highly polluted, vulnerable to fluctuations in coal prices, and at risk of angering countries afraid of climate change.

4.      Dependence on Exports

Exports account for 30 – 35% of the economic output of China and Russia. This is compared to only 10 – 15% for the US, Japan, the European Union, Brazil, and Pakistan, and between 15 – 30% for most other countries. This means that China and Russia are now relatively vulnerable to economic events that are beyond their ability to control. Russia, for example, experienced a decline in its economic growth rate from 7.5% between 2003 and 2007 to just 1% since 2007, in large part as a result of the languishing European economy that consumes the vast share of its exports.

5.      Dependence on Imports or Exports of Natural Resources

India has become dependent on importing foreign oil, mostly from the Middle East. Imports now account for more than 75% of India’s oil consumption and nearly 30% of India’s overall energy consumption. This has led India to develop the world’s largest trade deficit apart from the United States and Britain, in spite of having a massive wage-competitive workforce that produce goods and services for export.

China is not nearly as dependent on importing oil as India is, since so much of its energy comes from coal it produces domestically. However, China does depend heavily on imports for a number of natural resources of which it is the world’s largest consumer. These include copper, lead, nickel, zinc, tin, iron ore, timber, rubber, cotton, wool, and soybeans. In some cases this dependence is extreme: for example, China imports 85% of the copper and nickel it consumes, even as it consumes more than four times as much copper and three times as much nickel as any other country in the world. China also depends on imports for roughly two-third of its oil, though it is only the world’s second largest consumer of oil, still well behind the United States.

Russia’s economy, on the other hand, has become too dependent on exporting natural resources. An estimated 30% of Russian gdp comes from the production and sale of fossil fuels alone, even as Russia is also a leading exporter of a number of other commodities, such as diamonds, timber, and aluminum. If the profit margins of oil, gas, or natural resources in general decline, so too will the Russian economy. To a lesser extent this may also be true of the commodities Brazil produces: iron ore, crude oil, soybeans, and sugar account for an estimated 40% of Brazilian exports. (Brazil’s economy, however, is not very dependent on exports in general, so it could probably withstand low commodity prices better than Russia could).

6.      Income Inequality

Brazil has the highest income inequality levels of any large country. Russia, China, and India are not far behind. These inequalities are not limited to class-based or urban-rural divisions, but also include significant provincial and regional disparities. In China, for example, the 27 million inhabitants of Shanghai and Hong Kong have an average income that is 8 and 14 times higher, respectively, than that of the 65 million inhabitants of Guizhou and Gansu. In India, the 112 million inhabitants of Maharashtra have an average income 5 times higher than the 103 million inhabitants of Bihar. By comparison, average incomes in New York City are only 2.3 times higher than they are in Mississippi.

Life after BRICs

With the BRIC economies primed to slow down, a new emerging-market acronym is needed – at least, for the type of people who like such acronyms. Goldman Sachs, who’s chief economist Jim O’Neil coined BRIC over a decade ago, has since introduced MIST – referring to Mexico, Indonesia, South Korea, and Turkey. The Economist magazine and HSBC bank, meanwhile, have been pushing CIVETS, for Columbia, Indonesia, Vietnam, Egypt, Turkey, and South Africa. Investors have responded in both cases, purchasing tailor-made financial instruments that target the MIST and CIVETS countries. Each of these instruments received over a billion dollars of investment in 2013.

Both MIST and CIVETS are flawed, however. The MIST countries have almost nothing in common with one another, apart from the notable fact that they are all among the world’s 14-17th largest economies. Average incomes in Indonesia are three times lower than in Mexico and Turkey, and six times lower than in South Korea. Indonesia`s population is nearly five times larger than South Korea`s. South Korea relies on exports for 57% of its economic output, compared to only 25% for Turkey and Indonesia. Indonesia and Mexico are both leading natural resource exporters, while South Korea and Turkey are leading resource importers. 75% of Mexico’s exports go to the United States, compared to just 4% of Turkey’s. 31% of South Korea’s exports go to China, compared to just 4% of Turkey’s and 2% of Mexico’s. 50% of Turkey’s exports go to Europe, compared to 12% of South Korea’s and Indonesia’s and 6% of Mexico’s.

The CIVETS have even less in common. Indonesia has an economy that is more than six times larger than that of Vietnam, and a population that is four and a half times larger than those of Colombia and South Africa. Turkey’s average income is nine times higher than Vietnam’s. Columbia, South Africa, and Indonesia are all major exporters of natural resources, while Turkey is one of the largest resource importers. Vietnam depends on exports for 80% of its economic output, while Egypt and Colombia depend on exports for only 18% of their economic output, and none of the other CIVETS for more than 28% of their economic output. Over 40% of Colombia`s trade is with the United States, while 50% of Turkey`s is with Europe and 45% of Vietnam`s is with Northeast Asia.

It is true, of course, that all emerging market acronyms will inevitably be over-simplistic. Even in the case of the BRICs there were enormous differences between countries: China`s economy, for example, is thought to be larger than those of India, Brazil, and Russia combined, and the populations of China and India are significantly larger and poorer than those of Brazil and Russia. That being said, the BRICs grouping still makes some sense, perhaps, because the BRICs are the only developing countries to be among the world`s ten largest economies, nine largest populations, and seven largest landmasses. Furthermore, when BRICs was invented back in 2001, China`s economy was not nearly as far ahead of Brazil, India, and Russia as it is now, so the acronym made more sense at the time.

By comparison to BRIC, therefore, MIST and CIVETS seem to make little sense. For this reason, it may be appropriate to try to create a new acronym, one that can be of greater use to investors and other people interested in emerging markets. (Yes, there is no real reason to make such acronyms at all, but since it does not seem that they are going to stop being made and trumpeted by the media anyway, there might as well be a more fitting successor to BRICs than has been given thus far). So, with that in mind, let us now introduce the PIPE economies: the Philippines, Indonesia, Pakistan, and Egypt.

Meet the PIPEs

The PIPEs share a lot of noteworthy qualities. All have average incomes between $1300-3600 – or average incomes of $2600-3600 if Pakistan is excluded. All are among the 15 most populous countries in the world. All are among the six most populous countries in which average incomes are higher than $800 and lower than $6000. All except for Indonesia have GDP’s between $230-260 billion: indeed, Pakistan, Egypt, and the Philippines are the world’s 38th, 39th, and 42nd largest economies.

(Update, a year later: So far so good. In 2014, Pakistan, Indonesia, the Philippines, and Egypt had the four best-performing stock markets in the world outside of India, Argentina, Sri Lanka, and China-sans-Hong Kong) 

None of the PIPEs is too dependent on any single part of the world to consume their exports. Rather, they are each relatively well-diversified in their trade patterns between North America, Europe, Northeast Asia, and Southern Asia. None, for example, conduct more than 15% of their trade with any single country. Each conducts between 9-12% of their trade with the United States and 9-15% of their trade with China. None depend on exports for more than 26% of their gdp’s, for an average of just 20%.

All of the PIPEs have young populations, with between 6-9 % of their populations over the age of 60. All have fertility rates between 2-3 children per mother. All except the Philippines are Muslim – and the Philippines has a relatively large Muslim minority, accounting for 5 -10% of its total population.

All the PIPEs except Egypt have external debts equal to between 28-32% of their gross domestic products; they are three of the five economies in the world to be within this range, which is slightly lower than the average for developing countries. Egypt, meanwhile, has an external debt of 14%, one of the lowest in the world.

In terms of income inequality, the Philippines is the only PIPE to score poorly, according to the World Bank’s GINI Index. However, the Philippines still ranked as less unequal than China, Malaysia, or almost any country in Latin America or Sub-Saharan Africa.

The Philippines and Indonesia are both tropical archipelagos in Southeast Asia, and possess the first and second longest non-Arctic coastlines in the world. Egypt and Pakistan are both arid states located in the Greater Middle East, and are the first and second largest countries in the world to be oriented almost completely around a single river system (the Nile in Egypt, the Indus in Pakistan).

All the PIPEs except Indonesia are among the best English-speaking countries in the developing world. The Philippines is the world`s largest English-speaking emerging market (proportional to its population), while Pakistan is tied with Nigeria for second and Egypt is fifth. Indeed, in the Philippines, 57% of the population can speak English, compared to just 1-27% for the other developing countries in East Asia. In Pakistan, an estimated 49% of the population can speak English, compared to only 15-20% for its neighbours India and Bangladesh. In Egypt, 35% can speak English, compared to less than 20% in Turkey and less than 10% in most Arab countries. (Note: these language statistics need to be taken with an especially large grain of salt). 

In Indonesia, only an estimated 20% of Indonesians can speak English, which is about the middle of the pack for developing countries; less than Thailand, for example, but well ahead of Vietnam or Cambodia. However, because Indonesia is by far the most linguistically diverse country in the world, it may be that its proficiency in English will increase rapidly, so that English will join or perhaps even replace Bahasa Indonesia as the country’s primary lingua franca. Indeed, less than 10% of Indonesians speak Bahasa as a first language, and an estimated 90 million Indonesians barely speak Bahasa at all.

As a result, with Indonesia’s former colonial language, Dutch, having long disappeared from everyday life, many Indonesian children living in urban areas are now learning English significantly better than they are Bahasa. Indonesia was the world’s fourth-fastest adopter of English in 2013, for example, according to English First. In fact, Indonesia’s move towards English is not only due to its linguistic diversity, but also because it attracts more global tourism than any country in Southeast Asia apart from Thailand, and because it has close economic relationships with its two English-speaking next-door neighbours, Australia and Singapore.

All of the PIPE’s are located in areas that are likely to become the new centers of global trade in the years and decades ahead. As the economies of Asia and Africa emerge, the waterways linking the Indian Ocean to the Pacific and the Mediterranean are likely to become by far the most heavily trafficked trade corridors in the world. Indonesia and Egypt surround the two most important of these waterways: the Suez Canal and the Indonesian Straits. One of the Indonesian Straits, the Strait of Malacca, is in fact already the most heavily trafficked waterway in the world.

indian ocean

Pakistan, meanwhile, is centrally located in the Indian Ocean, almost exactly halfway between the Mediterranean and the Pacific. Pakistan also directly borders the Strait of Hormuz, the channel through which an estimated 35-40% of the world`s seaborne oil shipments and much of the world’s liquefied natural gas pass through each year. Finally, Pakistan is, along with Iran, the only country to border the oceanic trade routes of the Indian Ocean and the overland trade routes of Central Asia simultaneously.

The Philippines is also favorably located relative to the world’s major trade routes. Along with Indonesia, the Philippines is the only country situated in the part of the Pacific Ocean that connects Northeast Asia to both the Indian Ocean and  to Australia and New Zealand. In addition, the Philippines is, to a greater extent than any other Southeast Asian naion with the exception of Indonesia and Malaysia, located amidst the main crossroads of trade between Asia and the Americas.

trade routes

None of the PIPEs are dependent on coal for more than 22% of their energy usage, for an average of just 14%. Only Indonesia derives a significant share of its wealth from exporting commodities — and even Indonesia is not dependent on commodity exports when compared to many of the world’s other resource-rich developing economies. Exports are only equivalent to 24% of Indonesian gdp, compared, for example, to between 55% and 95% of the gdp’s of leading energy exporters like Saudi Arabia, Kuwait, the United Arab Emirates, Libya, Angola, and Azerbaijan.

Also unlike many other commodity exporting economies, Indonesia is not overly dependent on the price of oil and natural gas. Rather, in addition to being the world’s 7th largest net exporter of natural gas and 20th largest of oil, Indonesia is also the world’s largest exporter of coal, rubber, tin, nickel, coconut oil, palm oil, and aluminum ore.

Of course, the PIPEs are not risk-free environments. Like many other developing nations, the flip-side to their economic growth potential is their vulnerability to natural disasters and political upheaval, both of which may intensify as a result of factors like population growth or climate change. In addition, developing countries also tend to have a lot of exposure to the Chinese economy, the growth of which may be likely to slow or even crash at some point in the years ahead.

Indonesia and the Philippines could be particularly vulnerable to dangers such as these. While their direct trade exposure to China is relatively low, it is still high compared to most countries outside of East Asia. Plus, Indonesia and the Philippines trade a fair amount with other East Asian states, some of which have enormous trade relationships with China.

Finally, even though the fact that the Philippines and Indonesia have the world’s longest tropical coastlines may lead to great opportunities for their tourism and trade, it could also present serious storm and flooding threats. They are also at risk from earthquakes and, in some cases, volcanoes. The Indian Ocean tsunami of 2003, in which an estimated 200,000  people were killed in Indonesia alone, is of course the most tragic manifestation of such dangers to have yet occurred in the twenty-first century.

Top 10 Myths about the Global Economy

The 2000’s was a decade of rapid economic change. The Chinese economy grew enormously, and to a lesser extent so did the economies of Russia, Turkey, Saudi Arabia, Brazil, South Korea, India, and others. Mobile phones, smartphones, and the Internet changed the way billions of people live their lives and conduct business. Near the end of the decade there was a major shock to the global economy, dropping growth from about 4% between 2005 and 2007 to 1% between 2007 and 2009. The slowdown thrust millions of people into unemployment.

One of the byproducts of such speedy transformations has been confusion regarding the present configuration of the global economy. According to a 2011 Gallup poll, more than half of Americans believe that the world’s largest economy is China, whereas only thirty percent believe, rightly, that it is the United States. While some of the blame for ignorance of this kind should presumably go to the American education system and media, its root cause is probably just that the world has been changing so fast that people have not had the time to catch up to what is really going on.

With that in mind, in this article we have tried to compile the ten most widely held myths about the global economy. They are as follows:

1.      China Owns All Of America’s Debt

Contrary to popular belief, China only owns about 8 percent of American government debt and 2.7 percent of total American debt. This is not so unique: Japan, for example, owns 6 percent of American government debt, and England owns 2.5 percent of American government debt. China also does not receive as much leverage over the United States from these debt holdings as is commonly thought, because its economy is considerably more dependent on trade with the United States than the American economy is dependent on trade with China. China’s exports to the United States are equal in value to around 6% of China’s gdp, whereas American imports from China are equal in value to only around 1.8% of American gdp. Chinese leverage over the United States is also compromised by the fact that the United States military dominates the Indian and Pacific Oceans that China requires access to for nearly all of the imports and exports it depends on.

2.      China Will Soon Overtake the United States

For China’s economy to equal America’s even ten years from now it would have to grow at an average of 9 percent in real terms, assuming the economy of the United States would only continue at the relatively unimpressive rate of 2.5 percent per year it is currently growing at, and that exchange rates remain at their present rate. This would be a remarkable feat; in its entire mod­ern history China has only twice averaged an annual growth rate of more than 9 percent over the course of a decade, and no country in modern history has grown at an average of more than 10 percent over a period of five and a half decades, which China would accomplish if it  were to grow at such a pace over the next ten years. To say that China will definitely achieve such growth, therefore – when it is facing a huge number of challenges, including high commodity prices worldwide and slow growth among the Japanese and European consumers of its exports – is a bit of a reach. And of course it is also possible that the American economy will grow faster than it is expected to in the years ahead.

3.      America Doesn’t Make Anything Anymore

It has become popular to argue that the United States is becoming economically or even morally bankrupt because it no longer produces tangible goods, but instead focuses on service-sector industries like fast food and finance. The fact is, however, that America does produce tangible things: it still boasts the world’s first or second largest industrial sector (depending on which data you accept), even as the share of its GDP that the sector accounts for has shrunk significantly over the course of the past generation. America arguably manufactures more than China does, and it certainly manufactures far more than Japan and Germany do. In fact, because energy prices in the United States have recently become much cheaper than in Europe or Japan, the US may now also be able to grow its high-end manufacturing base faster than those of other large developed economies.

4.      2008 Was the Worst Recession Since The Great Depression

Okay, this myth may technically be true, perhaps. Still, by everyone constantly repeating it, the idea that 2008 was unprecedentedly similar to the Great Depression has been widely and wrongly perpetuated. The fact is that for most large economies – with the possible exceptions of Spain and Italy, and perhaps a few others – the 2008 crisis and the ongoing European crisis it spawned are actually more similar to the string of recessions that have occurred since the Great Depression than they are to the Depression itself.

Indeed, there might even be a case to be made that 2008 was the least painful of the major American economic crises to occur since the Great Depression, for instance because today’s unemployed have access to technologies that did not exist in previous recessions. Certainly the recessions of the 1970s and early 80s are too often overlooked in this discussion, perhaps due to nostalgia. In any case, it is still too early to tell. The Great Depression in the US saw little economic or employment growth for an entire decade, so at the very least we will not find out how apt the comparison is for  several more years.

 5.      Greece Matters

Greece`s economic problems have been discussed so often in the news that many people have gotten the idea that the country is a significant contributor of Europe’s overall economic crisis. It is not. Though extremely troubled, Greece is actually too small to affect Europe in any meaningful way beyond serving as a harbinger of or catalyst to its real problems – which include, for example, fifty percent youth unemployment in Spain, the world’s twelfth largest economy. The entire Greek economy is actually only about the size of that of Maryland; it is smaller than 16 other European economies. In other words, believing that Greece is the cause of Europe’s problems is sort of like believing that poor sales of snacks is why Blockbuster went bankrupt.

6.      India Is a Major Economic Power

Despite having a population of 1.3 billion people, India has a nominal economic output that is only about as large as those of Canada, Spain, or Mexico. Though India is undoubtedly a regional economic power, boasting an economy larger than those of Pakistan, Bangladesh, Saudi Arabia, Iran, Sri Lanka, and Myanmar combined, it is not yet a global power, and does not belong in the same breath with China as it is so often put.

One reason for this confusion is that economic size is often adjusted for purchasing power parity rather than looked at nominally, which puts India as the third largest economy in the world. While ppp-adjusted gdp is by no means irrelevant, it ignores the fact that India is one of the world’s most import-dependent economies: it is, for example, the largest or second largest importer of coal, oil, and weapons, and imports equal about 30% of its gdp, quite a bit higher than China and much higher than the US or Japan.  As a result, India’s exchange rates – i.e. its nominal gdp – cannot be ignored. Of course, India may still become a major economic power very soon. It might even wind up the world’s biggest economy at some point. But don’t be fooled: today India is a just an impoverished, second-tier economic power, with comparatively little say in world affairs beyond its own region.

7.      It’s Over For Japan

A rapidly aging population, two decades of economic stagnation, a highly publicized nuclear meltdown, and the spotlight-stealing dynamism of its Chinese and South Korean next-door neighbors has flipped perceptions of Japan from that of the rising power of the world in the early 1990’s to a fallen one today. Behind Japan’s low-growth exterior is an economy that is still the world`s third largest by far, however, bigger than those of Germany and England combined. In fact, if instead of using gross domestic product as a measuring stick you use the United Nations’ Inclusive Wealth Index – which attempts to measure not only growth itself but also the medium-term socio-political and financial sustainability of such growth – Japan’s economy ranks second, with a rating greater than those of China and Germany combined. So don’t count Japan out just yet.

8.      The World Is Flat

Globalization is real, but it is not yet as real as many people think. Here are a couple of statistics that should prove this: only an estimated 35 percent of people in the world have even the most basic access to the internet; North America relies on extra-continental trade that is equal in value to only around 7% of its economic output; Europe relies on extra-continental trade that is equal in value to only around 12% percent of its economic output. Among large economic regions only Northeast Asia is significantly globalized in its trading patterns, buying huge quantities of natural resources from the Persian Gulf, Southeast Asia, and the rest of the world,  and selling huge quantities of manufactured goods to North America, Europe, and the rest of the world.

But even Northeast Asia is far from being truly globalized. China, for instance, trades roughly 75 percent as much with Japan and 60 percent as much with South Korea as it does with the United States, even though the United States’ economy is more than three times larger than that of Japan and more than thirteen times larger than that of South Korea.For now, therefore, the world is not flat: local, regional, national, and continental links still remain economically more important than global ones.

9.      China Has A Massive Surplus

Politicians around the world often complain that China floods their markets with unnaturally cheap goods but is not willing or able to buy anything back in return. The fact is, however, that China’s economic surplus is not as large as it is generally portrayed, but only seems so because statistics falsely tend to treat Hong Kong and Macau – former British and Portuguese protectorates, now semi-autonomous administrative districts – as if they are still not part of China, though they both speak Cantonese and were officially integrated into the country’s political system in the late 1990s. Paul Krugman wrote an essay on this topic back in 1997, when China was acquiring formal control of Hong Kong back from the British.

Being metropolises, Hong Kong and Macau both import much more merchandise than they export; they can afford to do so because of sales of services – like tourism and finance – and through money that their wealthy residents earn on property or businesses that they own in other parts of China and throughout the world. Thus, when Hong Kong and Macau are counted, China’s trade surplus shrinks by about 15 percent, becoming significantly smaller than those of Germany, Russia, or Saudi Arabia, and smaller in proportion to total economic output than 10 of the world’s 25 largest economies. This reflects the fact that China actually does import a decent amount of manufactured goods, and a massive amount of natural resources, from countries around the world.

10.    It`s All About Culture

Lots of people believe that culture is the driving force of economics – that lazy Greeks, efficient Germans, ‘backward’ Arabs, Confucian Chinese, responsible Canadians, and innovative Americans are the determining players of the world we live in. This is mostly nonsense, in my opinion. Not only may such cultural descriptions be over-exaggerated stereotypes, they also fail to take into account the fact that culture – and, relatedly, politics – does not emerge from a vacuum, but instead stems from more fundamental influences like geography and historical circumstance. Indeed, it should not come as a surprise that physical geography alone does a far better job at explaining present economic outcomes than culture does.

Take Europe, for example. Its north-south economic split is not, as many people think it is, primarily the result of Siesta-inclined Mediterranean cultures, but rather is due to the fact that the Mediterranean region is fairly dry and almost entirely hilly or mountainous, whereas the North European Plain and England are mostly flat and filled with navigable rivers. This has led the two regions to develop very different social and political dynamics, and given a sharp economic advantage to northern Europe ever since the discovery of  trade routes to Asia that circumvented the Mediterranean.

Similarly, the few areas of Mediterranean Europe that are flat, fertile, and easily accessible by water (which are located almost entirely in southern France, northern Italy, and Catalonia) occupy less than 20% of the land in Europe that is situated within 400 km of the Mediterranean, yet account for more than half of its wealth. Geo-economic patterns such as these are hardly unique to Europe, in fact. For example, nearly every country in the world to the north or south of the Tropics has a per capita nominal gdp of more than $10,000, whereas nearly every country within the Tropics has a per capita nominal gdp of less than $10,000.

You Didn’t Build That

There is a widely held belief in Western society that culture, institutions, and history determine which countries become wealthy and which do not. In a certain sense this belief is accurate: rule of law is clearly superior to anarchy, hard work and generosity are superior to laziness and selfishness, a peaceful history is superior to a war-torn one, and so forth. However, this argument still leaves a crucial question unanswered: what influences the molding of culture, institutions, and history in the first place?

Part of the answer to this question must obviously be geography, the existence of which, unlike culture, predates humanity. However, mainstream opinion tends to be resistant to this view. While it accepts that the forces of geography are powerful, it does not agree that geography deserves most of the responsibility for determining the economic winners and losers of the present age.

A recent illustration of this is “Why Nations Fail: The Origins of Power, Prosperity and Poverty”, a highly acclaimed book coauthored by MIT economist Darren Acemoglu and Harvard professor James Robinson in 2012. The book argues, among other things, that geography-oriented approaches to economics are for the most part incorrect, as according to the authors such approaches fail to explain why North Korea is so much poorer than neighbouring South Korea, Zimbabwe is so much poorer than neighbouring Botswana, Haiti is so much poorer than neighbouring Dominican Republic, and northern Mexico is so much poorer than neighbouring American states like Arizona and New Mexico. They claim instead that it is the “inclusivity” of a country’s institutions that determines more than anything else its economic fate.

Is mainstream opinion correct on this matter? Or does it persist, perhaps, in part because its abandonment in favour of a more geographical view of economic development would seem to mean accepting a world where the fate of our lives and our countries has not been in our own hands, and where we in the West could no longer pat ourselves and our forefathers on the back for achieving our current level of prosperity and freedom relative to other societies?

Here’s the truth of it: geography has been by far the dominant force in determining which countries achieve wealth and which do not. If you don’t believe this, take a look at the following statistics:

The third largest economy in the world, Japan, has by some measures the world’s longest coastline if you exclude Arctic and tropical regions. The United States, the world’s largest economy, has the second longest coastline if you exclude Arctic and tropical regions. China, the world’s second largest economy, has the third longest. Britain, the world’s sixth largest economy, has the fifth longest. Italy, the world’s seventh largest economy, has the sixth longest.

The United States has by far the world’s largest system of interior waterways outside of the Arctic and the Tropics. China has the second largest. Germany, the world’s fourth largest economy, has the fifth largest. France, the world’s fifth largest economy, has the fourth largest. India, the world’s eighth largest economy, has the sixth largest.

Roughly three-quarters of Africa’s landmass is located between the Tropics of Cancer and Capricorn, between which lies the equator. Six of Africa’s eight largest economies, however – South Africa, Egypt, Algeria, Morocco, Tunisia, and Libya – are located outside of the Tropics.  10 out of the 17 largest countries in East Asia are located either entirely or almost entirely within the Tropics. East Asia’s four largest economies, however – China, Japan, Australia, and South Korea – are located either north or south of the Tropics. Almost two-thirds of South America is located within the Tropics. South America’s second and third largest economies, however –  Argentina and Chile –  are located outside of the Tropics, while about 60 percent of the wealth of its largest economy, Brazil, which is generated in the 10 percent or so of Brazilian territory that is located outside or almost outside of the Tropics.

World_map_indicating_tropics_and_subtropics

In China, more than half of all economic output is generated within the 10 percent or so of the country’s territory that is situated within 400 km of the sea. In Brazil, nearly two-thirds of all economic output is generated within the 20 percent or so of the country’s territory that is situated within 300 km of the sea. In Australia, more than 90 percent of all economic output is generated within the 15 percent or so of the country’s territory that is situated within 200 km of the sea. Similar patterns appear to various extents in most countries.

Deserts and mountains are not generally conducive to economic growth. The only mountainous country that  has a large economy and a high standard of living is Switzerland, which benefits from being located in between Germany, France, Italy, and Austria, while simultaneously having had its mountains insulate it from the devastating wars that wracked Europe throughout its history. The only wealthy desert countries that have high standards of living are those, like Kuwait, Qatar, or the United Arab Emirates, that also possess huge deposits of easily-accessible oil or natural gas.

Of course, there are cases where geography cannot easily be employed to explain economic disparities between two areas. When viewed in the context of the statistics listed above, however, these instances appear to be too small and anomalous to serve as a meaningful rebuke of geography’s influence. Indeed, some of the places most commonly listed as examples of geography’s limitations are arguably misunderstood by the people who claim them as such.

Take Korea, for instance. The hugely divergent standard of living between its dictatorial North and democratic South is one of the most striking and most widely cited cases of a place where geography does not seem to be able to offer an explanation for economic outcomes. Upon closer inspection, however, this may not be entirely the case.

After all, it was the North`s strategic geography, sharing a 1400 km long border with China and occupying a position alongside the narrow entrance to the Bohai Sea that most of northern China (including Beijing) is dependent upon in order to access the Pacific Ocean, which prompted the Chinese to sacrifice many hundreds of thousands of their citizens in order to push the American and South Korean armies southward during the Korean War of the 1950`s. In doing so, the Chinese ensured the continued existence of the North’s isolationist regime, which they have supported ever since in order to prevent a united Korea from forming. Thus, while the totalitarianism of the Kim family is undoubtedly the proximate cause of North Korea’s problems, geography in a certain sense is its root cause.

a

Indeed, the reluctance of East Asia’s other great power, Japan, to push for Korean unification may also have a bit to do with geography. Korea is only 200 km away from Japan, which is much  closer than Japan is to any other part of mainland Asia. This proximity historically allowed an intense animosity between the two countries, which in recent decades has arguably made the Japanese wary of the prospect of a reunified Korea that could potentially ally itself with other powers like the Americans or Chinese. The Koreans often resent the Japanese much more than they do the Chinese. Meanwhile, even the Russians may have an ongoing geopolitical interest in Korean weakness and fragmentation, since the Korean border is only about 100 km from Vladivostok, which is the only significant port city in all of mainland Pacific Russia.

Finally, it is perhaps worth mentioning that South Korea was itself a pretty harsh dictatorship well into its modern economic emergence; it used to have much more in common with North Korea than it does today.  Also, North Korea is, unlike South Korea, an extremely mountainous country, and extremely mountainous countries tend to be quite poor.

Geography and the United States 

One reason that geography is often underestimated as a driver of economic development is that once a geographically-lucky country becomes rich, it can afford to build infrastructure that can, to a certain extent, free it from its dependence on that same geography. The modern United States, for example, could afford to ignore conventional geographical forces when choosing to develop its desert cities like Las Vegas, Phoenix, or even Las Angeles (though of course, these cities exist for a different geographic reason: they are sunny and warm). More generally, the US today has such extensive road, railway, pipeline, and air travel networks that its river and coastal waterway networks are no longer so significant. As of 2011, the US transported more than twice the tonnage of goods by rail than it did by water, and almost 15 times more tonnage of goods by truck than by water.

If, however, you were to wind back the clock by 100 or 200 years, the map of leading US cities would seem to be highly determined by geography. New York City has been the largest city in the US for most of the country’s history. It is optimally situated from a geo-ecomomic perspective, with a very long and sheltered coastline (Manhattan and Long Island are both narrow islands, after all, while Jersey City and the Bronx are both long narrow peninsulas and Staten Island is, of course, also an island),  direct access to the Great Lakes-St Lawrence River network by way of the Hudson River (access which all other Northeastern US cities lack; see map below), and a position directly in the centre of the Boston-to-Washington D.C. region.

USA_topo_en

canal_map2

The Boston-to-Washington D.C. region has a temperate, coastal climate as well as  proximity to the Northern Atlantic – in contrast to the Carolinas, Georgia, or Florida, where the climate is often subtropical and the coast is both further south and further west. Boston-to-Washington D.C. is also where one of the world’s densest concentration of commercially-suited natural harbours and inlets are located. The largest of these, Chesapeake Bay, is where the twin cities of Washington and Baltimore are situated. Washington is located off the bay, however, up the Potomac River, for security reasons. Yet this did not prevent the British from setting most of it on fire, including the White House and the Capitol,  during the War of 1812.

Chesapeakewatershedmap

pop dens
US population density/major city map, in modern times

The US’s second largest city between the 1890s and 1990s was Chicago, which is where the gigantic Greater Mississippi river basin comes closest to joining with the equally significant Great Lakes-St Lawrence River basin. Chicago is also due west of New York City, and just 400 km north of St Louis, the place where the Mississippi and Missouri Rivers converge and then meet with the Ohio River just 200 km to the south (see map below). St Louis was the US’s fourth largest city between the 1890s and 1920s, and was the US’s largest city outside of the Boston-to-Washington D.C region or Chicago from the 1870s until the 1920’s.

America_rivers

In the 1840s, the US’s largest city apart from New York City was New Orleans, which is located at the exact point where the Mississippi River meets the Atlantic Ocean. New Orleans was also the US’s largest city outside of the Boston-to-Washington D.C. area from the 1820s until the 1870s. In fact, from the 1840s until the 1870s New Orleans was 2-4 times more populous than any other city in the entire southern half of the US. While today New Orleans is estimated to be just the US’s 50th largest city, it remains far and away the country’s largest port by tonnage handled, and is only 500 km from Houston, which has become the US’s fourth most populous city and second largest port by tonnage handled.

After overtaking the South Carolinian city of Charleston in the 1810s, New Orleans was not surpassed in population by any US city south of St Louis until the 1880s, when it was overtaken by San Francisco. Though today San Francisco may be much smaller than Las Angeles (though the Bay Area as a whole remains the 5th  largest urban area in the US),  as recently as 1890 it had a population six times larger than that of Las Angeles. San Francisco was blessed by geography, not only possessing the extremely large and sheltered San Francisco Bay, but also a location in the only spot where the Pacific Ocean directly abuts the Central Valley of California. It is also located around the midpoint of that valley’s length.

USA_topo_en1

Ironically, even as conventional wisdom has falsely proclaimed that geography is not as important as culture, this view may soon become true. Technology will continue to reduce the conventional influence of geography, and may therefore put the fate of the world more firmly into human hands (in a certain sense, at least). Even just in the next decade, it is plausible that there will be billions of new Internet users, hundreds of millions of new city-dwellers, and tens of millions of new millionaires. The future seems increasingly likely to be one in which we finally become free of geography’s mindless determinism. But for now we are not.