Examining China’s M&A Boom

An article in last week’s issue of The Economist showed that China’s outbound M&A activity[1] has risen sharply of late, up approximately fivefold since the summer of 2015 and eightfold above its average rate between 2010-2015.[2]

The article mentions that this increase could represent a troubling trend of capital fleeing China in response to China’s experiencing slowing economic growth and a gradually depreciating currency in recent years.

It then largely dismisses this theory, however, saying, “rather than sparking a stampede [of money] to the exits, it is more accurate to say that these changes [in China’s economic performance] have alerted Chinese firms to the fact that they are still woefully under-invested abroad. China’s share of cross-border M&A has averaged roughly 6% over the past five years, despite the fact that it accounts for nearly 15% of global GDP[3]”.

Implicit in these words is the expectation that a country’s share of global M&A should not be too different from its share of global GDP. Yet this overlooks several other factors that may determine a country’s propensity for engaging in M&A. These may include a country’s role in international trade, or a country’s proximity to other large economies or foreign financial hubs, or a country’s cultural and linguistic affinity[4] or political relationship with other large economies and foreign financial hubs.

China ticks each of these boxes in a notable way. It is both physically and linguistically isolated from most of the global economy beyond its own borders: East Asia outside of mainland[5] China accounts for only 12% or so of world GDP[6], while the combined GDP of the world’s majority-Chinese economies outside of mainland China is about nine times smaller than that of mainland China itself[7].

China’s political relations are somewhat fraught. 45% of East Asia’s GDP outside of mainland China occurs in China’s regional rival Japan[8], nearly half of the world’s GDP that occurs in majority-Chinese countries outside of mainland China itself occurs in Beijing’s rival Taiwan, and 25% of global GDP is from its potential rival superpower the US[9]. 

China’s propensity toward international trade is, similarly, not pronounced[10]. China accounts for an estimated 11% of international trade, compared to 15% of global GDP.

Finally, apart from Taiwan, the only notable majority-Chinese economies outside of mainland China are business-financial hubs: Singapore and Hong Kong. Such hubs historically tend towards very high M&A activity, and towards being net originators rather than targets of M&A deals[11]. China’s global share of outbound M&A might therefore be higher were these not financial hubs. If, for example, Hong Kong was considered to be part of mainland China[12], China’s outbound M&A would in most years have been meaningfully higher than it has been[13]. 

The value of China’s outbound M&A as a share of global cross-border M&A should perhaps be lower than China’s share of global GDP, then. Yet so far in 2016 it is on pace to be much higher than China’s share of global GDP. The M&A boom could be capital flight after all. 

————

NOTES:

1 — Specifically, the “value of announced outbound mergers and acquisitions including net debt of targets”, according to the article. Notably, however, “announcing deals is not the same as closing them. Between losing out to other bidders and rejection by regulators, China’s investment tally could fall [below what it has announced].” “Nevertheless”, it goes on, “the trend is unmistakable. In recent years China has consistently accounted for less than a tenth of announced cross-border M&A deals; this year its share is nearly a third.”

2According to this article in the Financial Times, Chinese buyers account for an estimated 15% of the value of cross-border M&A that has occured thus far in 2016”. The Chinese offer to buy the Swiss company Syngenta, if accepted, is roughly big enough to eclipse all outbound chinese M&A in any year before 2014.

3- The article goes on to say “…Strategic considerations—acquiring technology and brands that China lacks—are more important [than moving capital out of China] for buyers [of foreign companies], both to bolster their position at home and to speed expansion abroad.”

4 – The following quote is from Clifford Chance and the Economist Intelligence Unit, from 2012: “Despite the growing need for companies to invest in new markets in order to realise their growth ambitions, more than one-half say that they are discouraged from acquiring overseas because of concerns about bridging cultural differences. This rises to 63% for respondents in the US. Many companies admit that they find the softer side of deal-making challenging, with just 44% of companies saying that they are effective at handling cultural integration as part of the transaction process.”

5 — “Mainland China” in this case does not include Hong Kong, Macao, or Taiwan, but does include other Chinese islands like Hainan and Xiamen.

6 – If you also include India, Australia, and New Zealand this figure rises to 18%

7 -By comparison, even the nominal GDP of the United States is only 2.75 times larger than the combined GDP of Britain, Canada, and Australia. France’s GDP is only 3.15 times larger than that of Belgium plus Quebec. Even if you try to count the wealth of the entire Chinese global diaspora rather than just majority-Chinese economies like Taiwan, Hong Kong, and Singapore, it is still very small compared to the size of mainland China’s GDP.  If you assume, for simplicity’s sake, that there are 50 million “overseas Chinese” (the figure given, roughly, by Wikipedia), and that each has an average income of $25,000 (similar to the per capita GDP of Taiwan), then the overall income of the Chinese diaspora is $1.25 trillion — still little more than 10% of mainland China’s GDP.

8 – According to this source, “Chinese FDI in Japan and trade relations between the countries have a long history because of the relative cultural and geographic proximity between the countries (Alvstam et al., 2009). Also, China is one of the two most important trade partners for the Japanese economy. All this should, following the mainstream trade theories (e.g., Helpman, 1984; Helpman & Krugman, 1985; Petri, 1994), give favorable conditions for large inflows of FDI. In relative terms, this picture has to some extent been correct. Before the recent territorial row over the Senkaku, or Diaoyutai, Islands located between Okinawa and Taiwan, the Chinese and Japanese mutual cross-border M&As was steadily increasing with 2010 and 2011 as peak years recording 16 M&A deals, respectively (Recof, 2012). However, this trend seems to have been broken, by recording only 6 M&As in 2012, and 5 M&As in 2013.”

Japan was not even one of China’s top 10 targets of outbound M&A between 2005-2015— the biggest target for outbound Chinese and Hong Kong M&A was Britain (14.6% of the total). By comparison, 43.7% of Japan’s outbound M&A over the past 10 years went to the US. (Source: graphs from http://qz.com/465638/charts-and-maps-how-japans-companies-are-beating-chinas-in-overseas-ma/)

9- This is not to say the China’s relationships with Japan, Taiwan, or the US are nearly as troubled as many people think they are or would like them to be. Still, these relationships mean that China may have a very different outlook in foreign affairs than do many other countries.

10 – Indeed, one might expect China to account for a disproportionately large share of international trade, given its role as the ‘workshop of the world’ and its voracious appetite for imports of energy and minerals. But in fact China only accounts for about 11-12% of global trade as far as I can tell (using statistics from MIT’s Observatory of Economic Complexity), regardless of whether or not Hong Kong is included.

11-   In 2014, the largest M&A deal involving an Asian country, whether cross-border or domestic, was the acquisition of China’s CITIC Ltd. by Hong Kong’s CITIC Pacific Ltd., a deal that was worth about three times more than any other involving an Asian country that year. In 2015, in contrast, one of the biggest deals was, according to this article from Bloomberg, “China Cinda Asset Management’s (pending) $8.8 billion purchase of Hong Kong lender Nanyang Commercial Bank.” Singapore’s outbound M&A has been increasing by a huge amount in recent years too and is much higher than its inbound M&A.

12 —M&A statistics, moreso than many other economic or financial categories, tend to consider Hong Kong as being separate from the rest of the territories of the People’s Republic of China. This may be (at least partially) justified, but it can also confuse matters at times.

13 – In 2011, 2012, and 2013, Hong Kong’s outbound M&A was about 25-40% as large as mainland China’s, even though Hong Kong’s GDP is only around 2% as large as mainland China’s. Singapore’s outbound M&A, meanwhile, was 1.5-22% as large as mainland China’s during 2011, 2012, and 2013, while Singapore’s GDP was also only about 2% as large as mainland China’s.  (Source: Global Financehttps://www.gfmag.com/global-data/economic-data/value-of-cross-border-maa-by-region-country?page=2)

M&A Table

I made this chart in order to find correlations between outbound M&A activity (as given in column I, at the right end of the chart) and the factors in the four leftmost columns of the chart. Column I’s closest linear relationships are with columns E and F — though Japan is an outlier in both cases. Admittedly, though, this chart does not include enough countries or enough years of M&A to say much.

Column B is based on the regions Europe, North America, and East Asia. For example, the USA’s figure in column B is equal to the GDP of Canada plus the GDP of Mexico divided by the GDP of the world. Column C is based on two “super-regions”: the North Atlantic (including Europe and North America) and the Indo-Pacific. The US scores much lower than China in Column B – because North America minus the US has a much smaller GDP than East Asia minus China – but scores much higher than China in Column C, because the US is not far from Europe.

Column D is based on countries in which the majority language(s) is the same: China’s figure in column D, for example, is equal to the combined GDP of Taiwan, Hong Kong, and Singapore – the only other majority-Chinese economies – divided by the GDP of the world.

Labour Strikes in China

The China Labour Bulletin website provides maps displaying incidents of labour strikes that have occurred in recent years. While of course these should be viewed with a hefty grain of salt, they may be worth scrutinizing all the same.

This image below shows the number of strikes in general that have occurred since 2011: as you can see, they have been becoming a lot more common since the beginning of 2014.

since 2011 map

Yet this may be somewhat misleading: nearly half of the strikes indicated in the map above are thought to have had fewer than 100 people participate in them. It may be better to look just at the number of larger strikes that have occured, as the following two maps do:

1000-10,000, 2011.png

more than 10,000 persons since 2011
4 out of the 7 labour strikes involving 10,000+ people since 2011 occured in Guangdong province, according to the China Labour Bulletin

These maps above show that the larger strikes, with 1000-10,000 people and 10,000+ people, respectively, occured most often in 2014, unlike the smaller but more numerous strikes that occured most frequently in 2015 and so far in 2016. Since 2015 there have not been any strikes involving more than 10,000 people, according to the China Labour Bulletin.

chinese_provinces-map

Now let’s have a closer look at the differences between China’s many provinces. Below I have tried to graph the number of strikes that have occurred in each province, first since 2011 and then since 2015:

2011

2015Guangdong, China’s most populous province, finished at the top of both graphs, while Tibet, Qinghai, Hainan, Tianjin, Ningxia, Gansu, and Xinjiang finished at the bottom of both graphs. All of the provinces of China are more or less in the same position in both graphs, in fact. And there are no major regional patterns that can be gleaned clearly from either list.

1000 - 10,000 since 2015.png
Labour strikes since January 1, 2015 involving at least one thousand people. Guangdong had 27, followed by Jiangsu with 9 and Shandong with 8.

What if we adjust the figures to take into account the population size and GDP of each province?  Then we get the following graphs:

2011 pop

2011 gdp

Here Guangdong and Tibet again finished at the top and bottom of both graphs, respectively. Ningxia, however, which had finished fifth from the bottom before adjusting for population and GDP, has now moved up to second from the top. Ningxia is China’s third least populous province (the two Tibetan provinces, Tibet and Qinghai, are the least populous), is one of China’s five “autonomous regions” (the others are Tibet, Xinjiang, Inner Mongolia, and Guangxi), and, along with Xinjiang, has by far the highest concentration of Muslim inhabitants of any province in the country.

In the adjusted-for-population graph, China’s relatively small and wealthy “direct-controlled municipalities”, namely Shanghai, Beijing, Tianjin, and Chongqing, were much higher up than they were on the adjusted-for-GDP graph, with the exception of  Chongqing. (Chongqing is quite a bit less urbanized than the three others are). Shanghai and Beijing were third and fifth, respectively, while Tianjin, which was the least strike-prone of any province when adjusted-for-GDP, was close to the middle of the pack when adjusted-for-population.

Another big change was Hainan, China’s southernmost province and only island province (not counting Hong Kong, Macau, or Taiwan), which was third from the bottom before adjusting for population size or GDP, but fourth from the top when adjusting for GDP and eighth when adjusting for population size. Shanxi and Shaanxi, meanwhile, two neighbouring provinces located in and around the mountains of north-central China, moved from around the middle of the pack to near the top once adjusted for GDP and population.

map_1360

Shanxi in particular is China’s major coal producing region, and the coal industry has come under a lot of pressure in recent years, which may help explain Shanxi’s high position on both of these graphs. (Shaanxi too is a top coal producer. Inner Mongolia, though, China’s second biggest coal producer, is admittedly near the bottom of the GDP-adjusted labour strikes graph). Shanxi has also been arguably the main provincial target by far of Xi Jinping’s intense “anti-corruption” campaign.

Still, these graphs again do not prioritize large strikes over smaller ones. Below, then, are the strikes with between 1000 – 10,000 participants that have occured since 2011. Since there have been very few strikes with more than 10,000 participants, the 1000-10,000 category accounts for an overwhelming share of the large labour strikes that have taken place:

1000 since 2011

1000 since 2011:pop

1000 since 2011:gdp

The graph showing labour strikes with more than 1000 people since 2011, adjusted for GDP size, is I suspect the most important one. The population-adjusted graphs tend to somewhat misleadingly overemphasize the wealthiest provinces, like Shanghai or Tianjin, since they have lots of per capita economic activity and therefore also lots of per capita labour strikes. The graphs that are not adjusted at all skew in favour of populous provinces, meanwhile. The GDP-adjusted graphs, though, are perhaps the most indicative of provinces in which there may be growing social challenges to China’s political or economic establishment.

Notably, this GDP-adjusted graph is also the only one in which clear regional divisions can be seen. Apart from Guizhou, nine of the ten westernmost provinces in China- Tibet, Qinghai, Xinjiang, Yunnan,  Ningxia, Inner Mongolia, Sichuan, Chongqing, and Gansu – are in the bottom thirteen provinces of the list, and six are also in the bottom seven of the list. Seven of the top nine provinces on the list, meanwhile, are seven of China’s eleven eastern coastal states. These also happen to be the seven most southern coastal states on the Chinese mainland.

Beijing and the provinces around Beijing, like Liaoning, Hebei, Henan, Tianjin, Shanxi, Inner Mongolia, and Shandong, are near the bottom or the middle of the list. Shanghai on the other hand, as well as two of the three provinces that surround Shanghai, namely Jiangsu and Anhui, are quite close to the top of the list. Guangdong, which is the most populous province in China, remains far ahead at the top of the list. Three of Guangdong’s four neighbouring provinces, namely Jiangxi, Guangxi, and Fujian, are at the top of the list as well.

chinese_provinces-map

Remarkably, Guangdong’s GDP-adjusted figure for large labour strikes is roughly twice as high as any other province and five times the nationwide average. Guangdong has also been home to four of the seven labour strikes in China involving more than 10,000 people since 2011, according to the China Labour Bulletin. Given Guangdong’s enormous size and revolutionary history, this may be worth noting.

China-provincial-share-of-GDP

The other biggest outlier is the northeastern province of Heilongjiang, which apart from Guangdong had by far the most large strikes adjusted for GDP size. Heilongjiang has been a major oil and coal producing province, which may partially help to explain this. Strikes in the province have been putting its governor Lu Hao, the youngest provincial governor in the country, under a lot of political pressure of late.

Heilongjiang’s position also highlights an interesting trend: China’s most peripheral provinces, like Tibet, Guangdong, Heilongjiang, Xinjiang, Guangxi, Yunnan, Qinghai, Inner Mongolia, Hainan, and Jiangxi, are either at the very top of the list or at the very bottom of the list. Heilongjiang itself has the longest international border in China outside of the three “autonomous regions” of Tibet, Xinjiang, and Inner Mongolia. (Heilongjiang’s border with Russia is only slightly shorter than the entire US-Mexican border).

The China Labour Bulletin maps also zoom in to show which cities the strikes occured in, and gives basic information about them. For example:

CLB

It also breaks down the strikes by the response they are thought to have received, in five categories: “police”, “arrest(s)”, “government mediation”, “negotiation”, or “other”. According to the site, “Guangdong also led the country in the number of police interventions in labour disputes, accounting for about 19 percent of the total 831 incidents in which police were deployed and 24 percent of the incidents in which arrests were made”.

“Worker protests accounted for 38 percent of all mass protests by Chinese citizens last year, according to statistics published on the well-respected Wickedonna blog.”

To close, here are the numbers of strikes of all sizes since the beginning of 2015, adjusted for provincial population size and provincial GDP size. Guangdong is finally not at the top of either:

2015 pop

2015 gdp

But if you look only at large strikes since 2015, then Guangdong is back on top:

1000 - 10,000 since 2015.png
Labour strikes since January 1, 2015 involving at least one thousand people. Guangdong had 27, followed by Jiangsu with 9, Shandong with 8, and Sichuan with 5. There have been no strikes with 10,000+ people since the beginning of 2015, according to the China Labour Bulletin

Expect the Unexpected: 10 Reasons North Korea Could Soon Change Course

1. Russia’s economy is currently in disarray as a result of falling natural resource prices, slow economic growth in Europe, and its rivalry with the United States. Russia has been an ally of North Korea because it sees North Korea as a counterweight to the Chinese, Japanese, and US-backed South Koreans, the other powers in Northeast Asia. If Russia’s economy does not bounce back, North Korea will need to adapt to the weakening of one of its only friends in the world.

2. Russia has been looking to export commodities to South Korea, as Russia worries that Europe and Japan will reduce their imports of Russian oil and gas as a result of the Ukraine conflict, the American fracking boom, the end of Western sanctions on Iran, and the possibility of Japan turning its nuclear power plants back on. Though Russia is obviously not thrilled about South Korea’s close relationship with the United States, it might nevertheless be happy to see a more united Korea serve as a counterweight to China and Japan in the Pacific.

In addition, the most direct way for Russia and South Korea to trade with one another is via the 800 km of North Korean territory that separates Seoul from Vladivostok. This is particularly true of gas exports, which travel cheapest through overland pipelines rather than by undersea pipelines or LNG ships. It is also true of many other types of goods, however. Politics aside, it would often make more sense to cross North Korea rather than to load and unload ships in order to sail the 600 km of sea between Russia and eastern South Korean ports (which are themselves 150 km or so from Seoul).

map_vostok_eng.jpg


3. The youngest generation of the North Korean leadership, embodied by 33-year old Kim Jong Un, was raised during the 1990s, after the Soviet Union had fallen, after China’s economic miracle had begun, and after the Internet and satellite television had become common. Kim Jong Un himself went to school in Switzerland, a stark contrast to his father Kim Jong Il who may have been educated in China during the Maoist era.

Today Kim must be looking at Bashar al-Assad with fear. Like Kim, Assad took over at a fairly young age from a father who had been a larger than life figure. Assad lasted for one decade before the Syrian Civil War got underway; Lil’ Kim is now in the middle of his fifth year in office. Meanwhile, the number of North Koreans living today who were alive during the reign of the first Kim, Il Sung, is quickly falling.

4. Unlike most other poor countries, North Korea’s population is not young. Its population pyramid has two main bulges: one between 40-50 years old, the other between 15-25 years old. A decade from now, then, much of the older bulge will have become too old for manual labour, while the number of young people entering the workforce for the first time will have begun to drop off. At this point, North Korea may be more inclined to move away from a labour-based economy, which in turn will require it to import capital from abroad, perhaps from the South Koreans.

north-korea-population-pyramid-2014.gif

This aging also raises Korea’s family reunification issue: North Korea’s 40-50 year old cohort are in many cases the children of families who were divided by the peninsula’s split in the Korean War. The coming decade will be the last chance for many of these sundered families to get back in touch before their elderly parents pass away — and before this generation becomes old itself.

5. Back when China was run by committee, consensus, compromise, etc.,
it liked being compared to North Korea because it could say, in effect, “we may not have a liberal democratic political system, but at least we’re nothing like the government in North Korea”. Today, though, as China has been moving back in the direction of a more traditional persona-led dicatorship embodied by Xi Jinping, the last thing that the Chinese leadership wants is for Xi to be compared with Kim Jong Un.

Xi has yet to visit North Korea, even though Xi has been perhaps the most well-travelled leader in Chinese history, and the first ever to visit South Korea before North Korea. Kim Jong Un, in turn, has not yet travelled the 800 km from Pyongyang to Beijing. (In fact, Kim Jong Un has never officially left North Korea since taking over as its leader in 2012). This may soon change, however: Kim Jong Un may finally visit Beijing in the next few months.

6.  Japan could be coming back in a big way: Shinzo Abe’s revivalism – including the end of formal military pacifism and the symbolic 2020 Tokyo Olympics may just be the start. The Japanese economy is far less exposed to the Chinese economic slowdown than are those of South Korea and Taiwan. Japan might benefit more from Russia’s troubles than China will, given that China has often allied itself with Russia. Japan is also more dependent on energy imports than China, and so may be more likely to benefit from the fall in energy prices than China will.

Japan may benefit more than any other country from the coming era of robots, given its uniquely aged workforce and technological expertise — and given that robots might make China’s enormous human workforce less of an economic advantage over other countries than it is today. Whether Japan addresses its aging workforce dilemma by importing more energy to power robots or by continuing to outsource more of its industrial activity to countries like Thailand and Taiwan, however, it will have to become more active in the region, and thus potentially more aggressive in the region, in order to ensure its access to foreign markets.

If Japan’s reemergence causes the Chinese to want to create a rift in the US-Japan alliance, Korea is the best place for China to try to do so. The US loves its alliance with Korea, while Japan does not. The Japanese and Koreans have quite a tortured relationship, a legacy of Japan’s historical domination of the peninsula. The US would be thrilled by a more unified Korea, whereas the Japanese might be wary of one even in spite of their current rivalry with the North.

Consider the context for the Korean War (1950-1953): Japanese power had just been decimated in World War Two, so China helped to divide the Korean peninsula because it feared the American-allied unified Korea that had emerged at Beijing’s doorstep following the invasion of the North by America and the South. China did not have to consider using Korea to create a rift between the US and Japan, since Japan was not a player at the time. A somewhat similar situation occurred in 1990, when American power surged again as the Soviet Union fell and as Japan’s economy suddenly began its “lost decades” of slowing growth.

If Japanese power grows, however, China may want a more unified Korea as a buffer against the Japanese and as a prime way of splitting the American-Japanese alliance. Alternatively, if China and Japan can finally mend fences with one another politically, it may cause the United States (and/or Russia) to want a more unified Korea to serve as a counterweight to both China and Japan.

7. More so than during the 1990s,
when Russia and China were weaker than they are now and 9-11 had not yet occurred, the US has a lot to worry about today other than North Korea’s military programs. North Korea’s first nuclear tests were in 2005, possibly in order to win back American attention that had shifted to the Greater Middle East. Now, though, with the US still worried about the Muslim world and also concerned with Russia and China, there may be diminishing returns to this strategy of gaining aid and prestige by nuclear saber-rattling.

The move by North Korea in 2010 to kill 46 South Korean navy soldiers in the Cheonan ship attack, which was by far the most casualties the South’s military has experienced in decades, suggests that the North Korean leadership may be aware of these diminishing returns. More recently, so does the announcement by North Korea this past winter that it has successfully developed a hydrogen bomb.

8. South Korea’s economy is slowing because of China’s economic slowdown and because South Korea has now basically become a “developed” economy (its per capita income is estimated to be $28,000, in nominal terms). While South Korea does not want to pay the financial burden of resuscitating theNorth Korean economy, it could nevertheless see some opportunities for itself in engaging the North in trade.

North Korea, for example, has one of the world’s largest reserves of high-quality anthracite coal, while South Korea is one of the world’s leading importers of coal and of fossil fuels in general. And of course, North Korea has a cheap, Korean labour pool (and potential consumer base), at a time when South Korea’s workforce is no longer cheap or youthful by global standards.

relative trade northeast asia.png
Trade figures, adjusted for overall GDP size

9. Coal prices have plunged of late in China and in most of the rest of the world. This could put a lot of pressure on the North Korean economy, which has become the third largest supplier of coal to China in recent years. China accounts for more than 90 percent of all North Korean international trade. According to Reuters, “last year, North Korean coal deliveries to China surged 26.9 percent, making North Korea China’s biggest supplier behind Australia and Indonesia. Coal deliveries from Australia plunged 25 percent, indicating the increase in [Korean] imports may have been to help support this”.

10. With China and the wider Northeast Asian economy struggling after years of rapid expansion, ending North Korea’s isolation could be a good last-ditch attempt to stimulate regional growth. China, for instance, could try to use its position as the North Korea whisperer in order to gain economic favours from the United States. China also has an incentive to engage North Korea — and to have South Korea engage North Korea — because the last thing the Chinese want to deal with right now is a refugee crisis emerging on their border with North Korea in the unlikely but not impossible event of a state collapse occuring there. A few million Koreans already live in China near the North Korean border.

korea north.png

Finally, North Korea could benefit the regional economy by serving as a land route between China and South Korea. Seoul is just 500-600 km from significant Chinese cities like Shenyang and Dalian by way of the North, and 1150 km from Beijing. In the longer-term, the North Korean trade route could become even more commercially important if fixed links are built across the Yellow Sea between North Korea and China, across the Gulf of Bohai between the Chinese provinces of Liaoning and Shandong, or across the Korea Strait from Japan to the Korean peninsula.

———

So, could the era of extreme North Korean isolation from the world be reaching its final days? Certainly, from the US point of view, North Korea is something of a last man standing these days: of the six countries that the Bush government named as the “axis of evil” – Iraq, Iran, Syria, Libya, Cuba, and North Korea – Kim is now the only leader not to have been either toppled (Iraq and Libya), besieged (Syria), or moving towards warmer relations with the US (Cuba and Iran). Given the changes occurring all around it in Asia and the world, North Korea’s position no longer seems like an easily sustainable one. Reunification with the South or not, it still makes sense to guess that North Korea under Kim Jong Un will end up being very different from that of his father.

The Provincials — Image of the Day

the provincials

The graph above shows the size of countries’ largest provinces or states in relation to their  overall populations. So California, for example, is home to approximately 12 percent of the total population of the United States, whereas Ontario is home to 39 percent of Canada’s population and Punjab to 47 percent of Pakistan’s.

250px-Map_of_Argentina_with_provinces_names_en

The biggest standout here, though, is Argentina’s largest province Buenos Aires, which is by far the most populous of Argentina’s 24 provinces. In fact, the population of the province of Buenos Aires does not even include that of the “Autonomous City” of Buenos Aires – see map above – which is itself the fourth most populous province in the country. In Argentina’s presidential elections this past October, the two candidates were the leaders of the province of Buenos Aires and the Autonomous City of Buenos Aires, respectively.

Below is a graph, made using data taken from Wikipedia, which shows the GDP sizes of the biggest provincial/state economies around the world, in nominal terms. It is led by California, which is thought to have an economic output of nearly $2.3 trillion these days, larger than all but seven of the world’s countries. Given the nature of this information, though, this graph should probably be taken with a decent-sized grain of salt.

nominal gdp

13 of the 34 provinces/states in the graph above are in the USA, 9 are in China, and 13 are in other countries. Germany and Japan both have 2, but they are the only countries apart from the US or China to have more than 1 province on this graph.

No Indian states made it on to the graph above. On the graph below, however, which shows the 34 most populous provinces/states in the world, 11 are from India, whereas California, the most populous US state, is ranked 33rd. 17 out of 34 on the graph below are Chinese, and 6 are neither Chinese nor Indian. This graph also shows the territory size of each province.

prov

Note the dominance of India’s province Uttar Pradesh. In fact, India’s five most populous states – Uttar Pradesh, Maharashtra, Bihar, West Bengal, and Madhya Pradesh (combined population: approximately 580 million) – border one another in a direct line, and Uttar Pradesh also directly borders India’s seventh most populous state, Rajasthan, as well as India’s most densely populated state, Delhi (India’s capital). In China and the US, in contrast, some of the largest states, notably California, Texas, Florida and Illinois in the US and Guangdong and Sichuan in China, do not border any of the other most populous states within their own country.

inde49

In Germany, meanwhile, the fifth most populous state in the country, Hesse, directly borders all four of the most populous German states: North Rhine-Westphalia, Bavaria, Baden-Wurttemburg, and Lower Saxony. Hesse’s chief city is Frankfurt, a European finance and transport hub.

germany-regions-map-printable

Finally, in Brazil, the three most populous states, namely Sao Paulo (which is by far the largest), Minas Gerais, and Rio de Janeiro, directly border one another. Sao Paolo also borders the sixth largest state, Parana, while Minas Gerais also borders the fourth largest state, Bahia. The four largest Brazilian states are home to 48 percent of Brazil’s overall population.

Brazil_states_named


US Legal Immigration — Image of the Day

most-common-country-immigrants

most-common-country-immigrants-no-mexico

With all the disgusting Trump talk on the issue of illegal immigration that has been going on, the other main source of American newcomers – legal immigrants – is sometimes overlooked. The maps above were made by Giorgio Cavaggion, using data from the Department of Homeland Security of immigrants who “became legal permanent residents during the fiscal year of 2012.” That year over one million people in the US became Legal Permanent Residents. Here are 10 thoughts on the maps above:

1. Mexico Still Dominates

Even in spite of the big drop-off in immigration from Mexico to the United States (see graphs below), Mexico still ranks first in half of the states in the country. Only in the northeastern and north-central regions of the US, from Montana to Maine, is Mexico not #1.

2012-phc-mexican-migration-08aFT_14.12.26_BorderApprehensions

2. India a Strong Second 

India finished first in six states (Ohio, Pennsylvania, New Jersey, Connecticut, Delaware, and Virginia) and second to Mexico in twelve states (Washington state, Arizona, Texas, Wisconsin, Illinois, Missouri, Arkansas, Mississippi, Alabama, Georgia, South Carolina, and North Carolina). This is a big increase from previous generations (see graph below).

Still, nearly a third of all Indian immigrants in the US live either in California or New Jersey. More than 25% live in San Jose, Chicago, or Greater New York City. Also notable is that India’s many regions are not represented proportionally in America. Rather, Indian states like Gujarat and Punjab are highly over-represented. Gujaratis, for example, account for more than 20% of Indians in the US, though they are only 6% or so of the population within India itself.

pyramid5-2011
Population pyramid of Indian Immigrants in the US
sp-chart-aug13.jpg
Foreign-born Americans By Country of Origin. India still ranks far behind Mexico, and just barely ahead of various Pacific and Caribbean countries

3. Burmese in Fly-Over Country 

Burma (aka Myanmar) was first in Indiana and second to Mexico in Kansas, Oklahoma, Nebraska, and Iowa. This could be significant going forward, given that Myanmar may have finally begun to liberalize its political system and renew ties with the United States in recent years. Indeed, Myanmar has often been seen as one of Hillary Clinton’s primary achievements during her time as Secretary of State, so if she becomes president it could perhaps further impact the US-Burmese relationship. Since the mid-2000’s, though, most Burmese immigrants in the US have been from non-Burmese ethnic minority groups, like the Karen people.

4. Bhutan Surprises

I would never have guessed that Bhutan, a far-away Himalayan country of just 750,000 people, would finish first on this list in three separate states (Vermont, New Hampshire, and North Dakota). No other country, apart from Mexico, India, and the Philippines, was first in three or more states. And even the Philippines was first in just one of the Lower 48 states.

5. The French Connection 

Vietnam finished first in just one state, Louisiana, and the fact that it did reflects two different ways in which history continues to inform the present-day United States. First is the French connection: Louisiana and Vietnam were both part of the globe-spanning French Empire, a fact that seems to resonate today even though neither Louisiana nor Vietnam even speak much French anymore. Or maybe Vietnamese just enjoy New Orleans jazz.

Second is the American military: wherever it goes, people from that country tend to end up in the United States. The Vietnamese have now become one of the biggest non-Hispanic groups in the US apart from Chinese and Indians, as have immigrants from Korea and the Philippines where the US also fought significant wars during the 20th century.  Iraq too has seen its share of immigrants to the US grow over the past decade: on the maps above, Iraqis finished first in Michigan and second to Mexico in Tennessee and Idaho.

6. Cubans in Kentucky, Dominicans in Massachusetts 

One might have expected Cuba to finish first in Florida, but in fact Mexico took that honour, leaving Cuba in second. But while Florida was the only state where Cuba finished second to Mexico, Kentucky, surprisingly, was the only state where Cuba finished first overall. Massachusetts and Rhode Island, meanwhile, were taken by the Dominican Republic, which did not finish second to Mexico in any states.

Though Cuba and the Dominican were the only two Spanish-speaking countries apart from Mexico on either of the maps above, the United States of course also has a very large population from other Latin American countries. These did not finish first – or second to Mexico – in any states, however, because many live in Washington D.C. (Salvadorans in particular) or in major immigrant-rich states like California, New York, and Florida, or come from Puerto Rico which is not considered to be a foreign country, or have not yet become Legal Permanent Residents.

7. East Asia in the West 

This is an obvious one: immigrants from East Asian countries often continue to cling to the Pacific Ocean even once they reach the United States. Though Mexico still finished first throughout the entire US West Coast, the Philippines finished first in Hawaii and Alaska and second to Mexico in California, Nevada, New Mexico, and Wyoming. Oregon and Utah, meanwhile, were the only two states in which China was second to Mexico. India, though not a Pacific country, was second to Mexico in Arizona and in Washington state.

8. East Africa in the North

Of the ten states in the Lower 48 which directly border Canada, Mexico finished first in just two (Washington state and Idaho), Canada finished first in just one (Montana), Bhutan finished first in three, Somalia in two (Maine and Minnesota), and Iraq in one (Michigan). Another East African state, Ethiopia, finished first in nearby South Dakota. Ethiopia also finished second to Mexico in Colorado.

9. Filipinos in Coal Country

Outside of the offshore states of Hawaii and Alaska, the only state the Philippines finished first in was West Virginia. Outside of California, Nevada, and New Mexico, the only state the Philippines finished second to Mexico in was Wyoming. Today Wyoming accounts for approximately 40% of US coal production and West Virginia accounts for about 10% of US coal production. Both states produce considerably more coal than any other state; only Kentucky even comes close to  their level of coal production. Wyoming, West Virginia, and Alaska also have the highest per capita energy production of any states in the country.

10. China “Seemingly” Underrepresented

China, in spite of its huge population, only finished first in one state, and only finished second to Mexico in two states. This could be a bit misleading, though, since the state that China finished first in was New York. New York was the only one of the “Big 4” states (California, Texas, Florida, and New York) not to be finished by first in by Mexico, and, with the exception of Michigan, it was the only one of the fourteen most populous states in America not to be finished first in by either Mexico or India.


Capital Idea — Image of the Day

Capital_City_Plaza_Hotel

Countries have different way of ordering their own provinces and capital cities, and how they choose to do so may sometimes say a lot about what sort of politics they have. Where countries’ capital cities are concerned, there is usually something akin to one of the following four set-ups:

  1. The Argentine model: the country’s capital city serves as its own unique administrative district and is surrounded on all sides by a single province that it influences to a large degree.
  2. The American model: the capital city serves as its own unique administrative district but is not surrounded by a single province (or state, etc.), but rather by two or more provinces.
  3. The Saudi model: the capital city is not its own unique administrative district, but is part of an important province that is named after itself.
  4. The Canadian model: the capital city is sometimes annoyingly full of bureaucrats, but is otherwise more or less a normal place. It is not its own administrative district.

The Argentine Model 

250px-Map_of_Argentina_with_provinces_names_en

Examples of the Argentine model include, of course, Buenos Aires, which is surrounded by the province of Buenos Aires (Argentina’s recent presidential election, in fact, was between the mayor of Buenos Aires and the governor of Buenos Aires province); Berlin, which is surrounded by Brandenburg (see map below); Moscow, which is surrounded by the Moscow oblast; the Australian Capital Area, which is surrounded by New South Wales (see map below), Vienna, which is surrounded by Lower Austria; Brussels, which is surrounded by Brabant (though Brussels does not directly border Walloon Brabant, which is several km to the south of Brussels); Prague, which is surrounded by the Central Bohemian Region; and Addis Ababba, which is surrounded by Oromia.

Australian-States

Germany-Map.jpg

oesterreich_karte_en


Beijing probably also belongs in this category: it is surrounded mostly by the province of Hebei but in two spots also by the city of Tianjin, which like Beijing is one of China’s four “direct-controlled municipalities” (the other two are Shanghai and Chongqing). Tianjin was temporarily made part of  Hebei province in the 1960s, and in recent years there has been much talk of increasing integration and cooperation between Beijing, Hebei, and Tianjin in order to form a sort of capital city macro-region, which is often referred to by the acronym Jingjinji.

20150530_CNM939

Seoul in South Korea has a similar set-up to Beijing. It is surrounded almost entirely by the province of Gyeonggi, but also touches the coastal city-province of Incheon, in the same way that Beijing does the city-province of Tianjin:

South-Korea-Divisions-Map.png

Note by the way that South Korea has a number of city-provinces. Of these, only Gwangju, in the southwest, conforms fully to the “Argentine model”.

Paris too may be included in this list; Paris is not itself a province, but it is surrounded on all sides by Ile de France, one of France’s 13 regions. (Prior to the beginning of this year Ile de France was one of France’s 22 regions, but these have since been reordered and reduced).


The American Model 

md-map

Capitals which are their own unique administrative districts but lack their own single encircling province include Washington D.C. (which is surrounded by both Virginia and Maryland), Tokyo, London, Delhi; Mexico City, Bangkok, Tehran; Hanoi, Abuja (though Nigeria’s largest city by far, Lagos, which was the capital until 1991, is an example of  the Argentine model), Baghdad (which is surrounded by four other provinces), Manila, Jakarta, Madrid, Islamabad, Brasilia (though just barely …and the capital of Brazil prior to 1960 was Rio de Janeiro), Kinshasa, and Bogota (though in a relatively weird way; see map below, Bogota is the sliver between the departments of Cundinamarca – which Bogota is also the capital of – and Meta).


colombia

One feature that a number of these have in common is that, while the capital city’s administrative district often borders two other provinces, it is usually surrounded much more by the less populous of the two other provinces. Notable examples of this include Washington D.C., which is surrounded much more by Maryland (population 5.9 million) than by Virginia (population 8.3 million); Delhi, which is surrounded much more by Haryana (25 million) than by Uttar Pradesh (205 million); and Brasilia, which is surrounded much more by Goias (6.5 million) than by Minas Gerais 21 million.

Brazil_states_namedinde49

Capitals which do not fit this pattern, however, are Mexico City, where the federal capital district is surrounded much more by  the state of Mexico (population 16 million) than by the state of Morelos (population 1.9 million); and Islamabad, which is surrounded much more by Punjab (population 91 million) than by Khyber Pakhtunkhwa (population 27 million).

mapmexicobasic

PakistanProvincesMap


A number of non-capital cities, meanwhile, such as Hamburg, which is the most populous city in Germany apart from Berlin, fit into this category as well.


The Saudi Model 

saudi-arabia-political-map

A capital city which is not its own unique province, but rather is part of an important province named after itself. Examples may include Riyadh, Stockholm, Dhaka, Santiago, and Ankara. Bern also could probably be on this list, but Bern is only the de facto capital of Switzerland; Switzerland has no de jure capital city.

Map-of-Turkey-and-81-provinces.jpg


The Canadian Model 

Examples of countries in which the capital city is not its own unique independent unit may include Ottawa, Amsterdam, Rome, and Warsaw.

According to Wikipedia “two national capitals in federal countries are neither federal units [like provinces, states, etc.], special capital districts, nor capitals of federal units: Ottawa, the capital of Canada [because Toronto is the capital of Ontario, the province in which Ottawa is located], and Palikir, the capital of the Federated States of Micronesia“. Ottawa is situated entirely within the province of Ontario, but also directly borders French-speaking Quebec.

maxresdefault
Ottawa
93f88daab2d2ff195b57f9c71ee3db76
Palikir


Please let me know if I’ve made a mistake on any of these; administrative divisions can be a bit complicated – and I can be a bit lazy.


East Asian Trade – Image of the Day

From Finally Passing Gas: 10 Winners and Losers of the Panama Canal Expansion:

trade asia

A typical assumption has been that China and Japan will be the primary beneficiaries of the canal. China, after all, leads the world in importing commodities and exporting bulk goods, and Japan has accounted for 40% of the world’s LNG imports – far more than any other country – in recent years.

Yet while China and Japan lead the pack in terms of the value of their absolute trade, they lag far behind both South Korea and Taiwan in the more relevant category of relative trade; that is, the value of their trade relative to the overall size of their economies. As can be seen in the chart above, the economies of China and Japan are generally not as trade-oriented as those of South Korea and Taiwan. As such, they might not benefit as much from the canal, which is intended to ease trade — in particular LNG trade, which the pre-expansion canal could not facilitate.

Of course, none of this means that South Korea and Taiwan are risk-free investments. They are not. Both, for example, have significantly more exposure to China’s economy, which has been struggling of late, than Japan does. All else being held equal, though, South Korea and Taiwan appear likely to be two of the greatest beneficiaries of the new canal.


The Geopolitics of Cheap Energy

Oil prices have fallen again: they are now at $29 a barrel for West Texas Intermediate crude and a similar price for Brent, their lowest since 2003. Natural gas, coal, and other commodity prices have also been dropping of late, in most cases. So: what will be the geopolitical consequences of cheap energy in general and of cheap oil in particular, all other things being theoretically held equal?

One consequence of cheap energy is the weakening, possibly, of four potential great powers: Russia, Brazil, China, and Mexico. While the media has understood the Russian and Brazilian half of this list – their economies are both estimated to have shrunk by 1-3 percent druring 2015, after all, which is difficult to miss – it has largely failed to register the Chinese and Mexican half. This is because it views China as being a leading oil, energy, and natural resource importer rather than as a resource exporter like Russia or Brazil, and because it views Mexico as merely a source of drugs, migrants, resorts, and cheap goods rather than as a potential great power.

China

China may be the world’s largest energy importer, but it is has also become its second largest energy producer, and as such only relies on energy imports for an estimated 15% of its total energy consumption, in contrast to 94% in Japan, 83% in South Korea, 33% in India, 40% in Thailand, and 43% in the Philippines. In 2014 imports of oil were equal in value to just around 2.4 % of China’s GDP, according to the Wall Street Journal, compared to 3.6% in Japan, 6.9% in Korea, 5.3% in India, 5.4% in Thailand, 4% in the Philippines, and 3.3% in Indonesia.

South Korea and Japan also imported more than two and four times more liquified natural gas, respectively – the prices of which tend to track oil prices more closely than conventional natural gas prices do – than China did. China’s LNG imports barely even surpassed India’s or Taiwan’s. China’s imports of natural gas in general, meanwhile, were less than half as large as Japan’s and only around 20% percent greater than South Korea’s.

China, furthermore, tends to import energy from the most commercially uncompetitive, politically fragile, or American-hated oil-exporting states, such as Venezuela, Iran, Russia, Iraq, Angola, and other African states like Congo and South Sudan. In contrast, Japan and South Korea get their crude from places that will, perhaps, be better at weathering today’s low prices, namely from Kuwait, Qatar, the UAE, and Saudi Arabia. Similarly, China gets much of its natural gas from Turkmenistan, Uzbekistan, and Myanmar, whereas Japan imports gas from Australia and Qatar and South Korea imports gas from Qatar and Indonesia.

China’s top source for imports of high-grade anthracite coal, and its third largest source for imports of coal in general, is North Korea. China has, in addition, invested capital all over the world in areas hurt by falling energy and other commodity prices, including in South America, Africa, Central Asia, Canada, and the South Pacific.

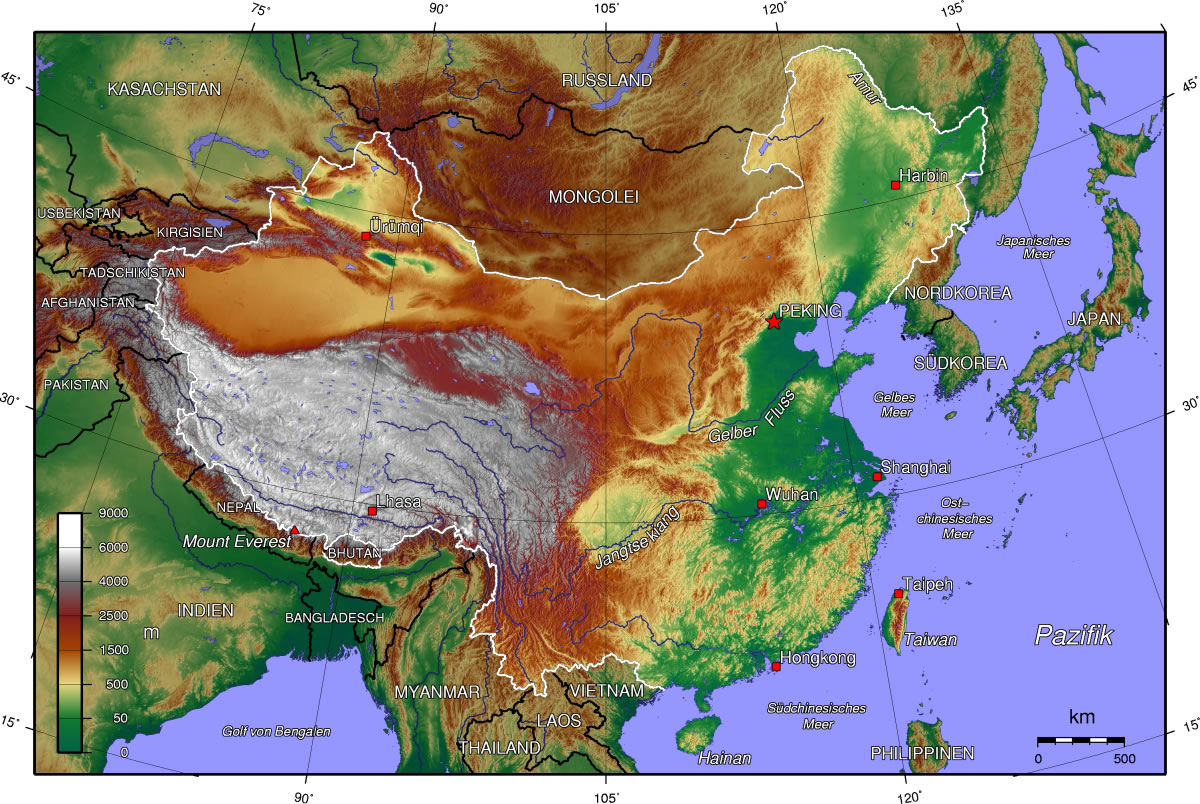
Another mistake the media makes is looking at China as if it were a country, rather than what it really is: both a country and a continent. Continents have internal, deeply-rooted regional divisions, and China is no exception. Its main divide is between areas south of the Yangtze River, which tend to be mountainous, sub-tropical, and dependent upon importing fossil fuels, and areas north of the Yangtze, which tend to be flat, more temperate, and rich in fossil fuels.

Northern China, stretching over 1000 km from Beijing southward to Shanghai on the Yangtze, is the country’s political heartland. It is densely populated and home to most of China’s natively Mandarin-speaking, ethnically-Han citizens. When compared to southern China, the north has historically been somewhat insulated from foreigners like the Europeans, Americans, and even Japanese. Beijing’s nearest port is roughly 5000 km away from Singapore and the Strait of Malacca; Hong Kong, in contrast, is only around 2500 km from Singapore and Malacca. Beijing is rougly 2600 km from Tokyo by ship, whereas Shanghai is just 1900 km from Tokyo and Taipei is just 2100 km from Tokyo.

Japan’s Ryukyu island chain and the Kuroshio ocean currents historically allowed for easy transport from Japan to Taiwan and the rest of China’s southeastern coast; the Japanese controlled Taiwan for more than three and a half decades before they first ventured into other areas of China in a serious way during the 1930s. Even today, Japan accounts for a larger share of Taiwan’s imports of goods than do either China or the United States.

Southern China has often depended on foreign trade, since much of its population lives in areas that are sandwiched narrowly between Pacific harbours on one side and coastal subtropical mountain ranges on the other. In northern and central China, in contrast, most people live in interior areas rather than directly the along the Pacific coast. These people in the interior generally did not engage in as much foreign trade, as in the past moving goods between the interior and coast was often limited by the fact that northern China’s chief river, the Huang-he, was generally unnavigable and prone to flooding northern China’s flat river plains, destroying or damaging roads and bridges in the process.

In southern and central China, by comparison, even people living far inland could engage with the coast by way of the commercially navigable Yangtze and Pearl Rivers, which meet the Pacific at the points where Shanghai and Hong Kong are located.

Northern China, however, was most directly exposed to the land-based Mongol and Manchu invaders who ruled over the Chinese for most of the past half-millenium or so prior to the overthrow of the Manchu Qing Emperor in 1912. Today the north continues to retain the political capital, Beijing, and a disproportionally large majority of Chinese leaders were born in north China — including Beijing-born Xi Jinping and Shandong-born Wang Qishan (a former mayor of Beijing) — in spite of the fact that most Chinese political revolutionaries, including Mao Zedong, Deng Xiaoping, Chang Kai-Shek, Sun Yat Sen, Zhu De, Ye Jianying, Hong Xiuquan, and famed writer Lu Xun, hailed from southern or south-central China.

Today, out of China’s seven Standing Comittee top leaders, only seventh-ranked Zhang Gaoli was born in southern China, whereas five of the seven were born in northern China and one, Premier Li Keqiang, was born in central China. Zhang Gaoli may in fact be the first person born outside of northern or central China in thirty years to have made it to the Standing Committee. He is also the only person currently in the 25-member Politburo born outside of northern or central China. Among the 11-man Central Military Commission, meanwhile, seven were born in northern China, while two were born in north-central China and two in south-central China. Out of the 205 active members of the Party Central Committee, fewer than 15 were born south of central China.

Indeed, the southern half of China, stetching from islands in Taiwan, Hainan, Hong Kong,  Xiamen, and Macau in the east to the plateaus of Yunnan, Sichuan, and Tibet in the west, is politically peripheral. It is home to a majority of China’s 120 million or so non-Han citizens (most of whom are not Tibetan or Uyghur, though those two groups recieve almost all of the West’s attention), China’s 200-400 million speakers of languages other than Mandarin, China’s tens of millions of speakers of dialects of Mandarin that are relatively dissimilar to the Beijing-based standardized version of Mandarin, most of China’s 50-100 million recent adopters of Christianity, and most of China’s millions of family members of the enormous worldwide Chinese diaspora.

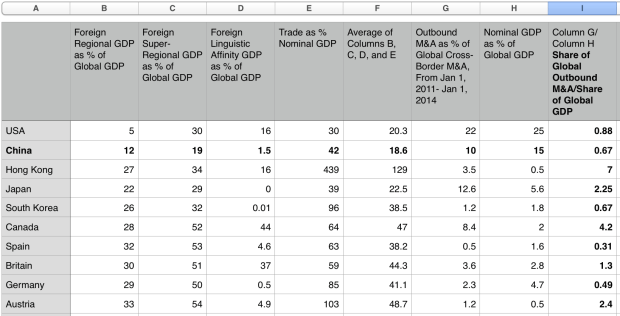
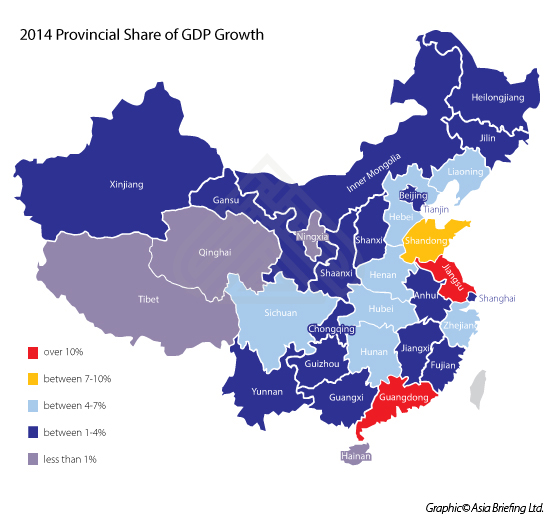
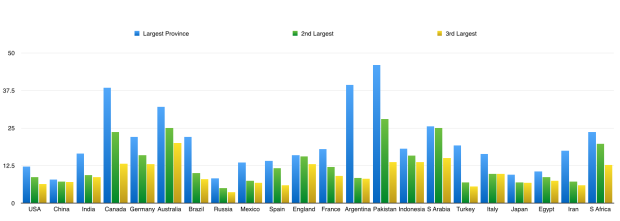
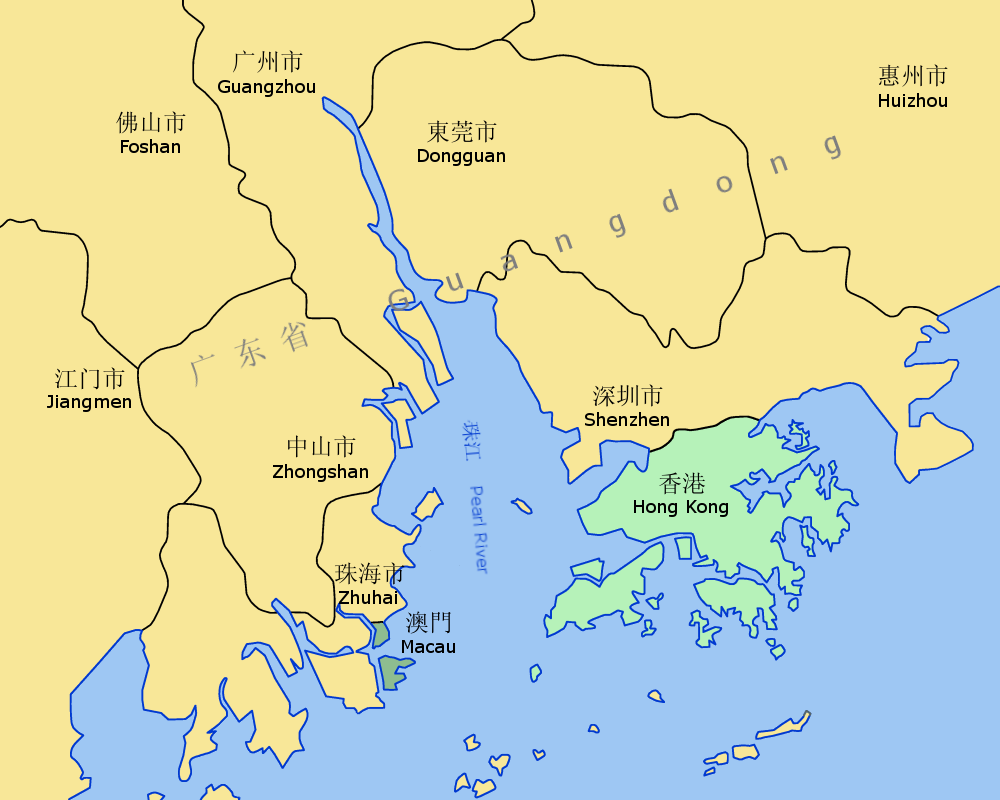
Southern China is physically closer to Southeast Asia (a region with a huge Chinese minority population) and most of the populous areas of Japan, and further away from sparsely populated Mongolia or Siberia, than northern China is. The south’s Fujian province, in particular, is linguistically and economically close to Taiwan, while the south’s Guangdong province is close to Hong Kong. A large share of China’s GDP comes from the coastal areas of China from around Shanghai south to Guangdong, particularly if you include Taiwan as part of the country. Guangdong alone accounts for an estimated 10% of mainland China’s GDP and over 25% of its exports. This creates a somewhat unbalanced dynamic: China’s political periphery is also its economic centre.

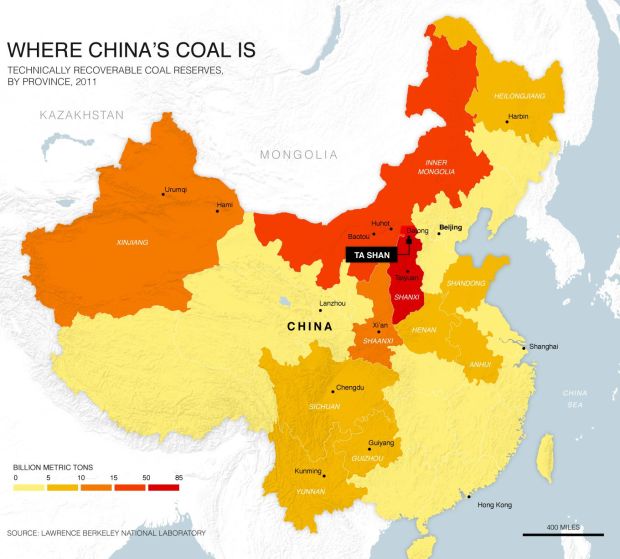
As it happens, northern China produces almost all of China’s fossil fuels (particulary in and around Shanxi province, 300 km or so inland from Beijing, where a large share of China’s coal is mined and which has seen the biggest political shakeup of any province from Xi Jinping’s anti-corruption campaign thus far), whereas southern and central China, especially if you include the neighbouring economy of Taiwan as being part of China, account for most of China’s imports of energy. Taiwan, in fact, may be more dependent on oil imports than any other significant economy in the world. Falling energy prices may weaken the Chinese political heartland relative to its periphery, in that case. Whether or not this will generate any political instability going forward remains to be seen.

If (a big if) energy prices remain low for a sustained period, then the question of China’s future dependence on imported energy also becomes relevant, as does the question of the future dependence on imported energy of China’s most important neighbours. In that case, how dependent on energy imports will countries like China, Japan, and India be in a decade or two from now?

While it is impossible to know what the future will be like, it is not difficult to imagine that China will remain less dependent on energy imports than India and/or Japan during the years or decades ahead, as a result of India’s still-emerging economy and Japan’s still-roboticizing economy.

China is not likely to be a major adopter of energy-intensive robots, in per capita terms, because China has a far larger cheap labour force than any country in the world apart from India. Japan, in contrast, will likely help lead the robot revolution, as its labour force is expensive and aging rapidly. This could make Japan even more dependent on importing energy, as machines that are both highly mobile and capable of sophisticated computation require an enormous amount of energy to run — and indeed, one of their main advantages over human labour is that they can and frequently will be tasked to run 24-7,  without even taking any time off for holidays or sick days.

China is not certain to increase its energy imports nearly as much as less-developed economies like India, meanwhile, as the Chinese inudstrial sector is facing challenges as a result of its past generation of energy-intensive growth. China faces rising labour costs in its cities, a pollution problem, crowded transportation infrastructure, a US that is concerned with Chinese industrial power, and countries throughout the world afraid of China’s world-leading carbon emissions. In addition, China is located much further away from the Persian Gulf and Caspian Sea oil and gas fields than the Indians and other South Asians are, and so might have difficulty accessing them in a pinch.

China may also have to face industrial competition from resource-rich or capital-rich economies such as Australia, Norway, Canada, Qatar, Texas, and maybe even Hong Kong, which will perhaps be able to use energy-intensive robots of various kinds to build up their manufacturing sectors in spite of their small labour forces. This could make China’s industrial growth rate slip, which in turn might reduce China’s resource imports and thus prevent China from becoming the leading beneficiary of low energy and commodity prices.

Such a shift will be especially likely if the United States or European economies decide to enact tariffs on goods coming from places that generate power by using coal in inefficient ways, a prospect that has become increasingly likely as a result of America’s triple-alliance between environmentalists opposed to coal consumption, shale gas producers competing with coal, and energy companies trying to pioneer more expensive but cleaner ways of consuming coal. China may then have to focus on growing its service sectors instead of its energy-intensive industrial sectors.

Japan, lastly, might benefit from Russia’s energy-related woes more than China will. This is not only because the Chinese have to a certain extent often looked to Russia as an ally against the West, but also because the areas of Russia that China is close to are mostly irrelevant to China: they are landlocked, Siberian, and for the most part located far from China’s population centres. Pacific Russia, in contrast, located next to the Sea of Japan on the East Asian side of Russia’s Pacific mountain ranges, has a far more liveable climate than the continental Siberian interior, is home to a number of useful medium-sized port cities, and accounts for much of the oil and nearly all of the Russian natural gas exports to Asia — led by energy-rich Sakhalin Island, which is just 40 km away from Japan and was partly owned and inhabited by the Japanese prior to the Second World War.

Russia may, in fact, be somewhat better prepared to fight another border war with China like it did in 1969, which might not be too different than the many other wars Russia has fought around its own borders both prior to and since then, than it would be to face off against Japan again within its far-eastern, mountainous, archipelagic and peninsular Pacific region, as it did in 1905 and then during World War Two. Of course this does not mean Japan will attack Russia — though it has certainly toyed with the idea of making more forceful moves in the Southern Kuril Islands, which both countries claim as their own. Even the unspoken possibility of conflict, however, may help grant the Japanese leverage over Russia in negotiations relating to commercial or political issues.

Mexico 

Mexico is much more than just America’s messy basement. It has the world’s 11th largest population,14th largest GDP, and, because it is in the New World, its population is in many ways much more internally unified than those of most other large countries are. It also has important ties to the rest of the Spanish-speaking world, to the Latin-based world in general, and to the 35 million or so Mexicans in the United States in particular, most of whom live in states adjacent to the Mexican border. Mexico is the clear potential leader in the Spanish-speaking world: its population is bigger than those of Colombia, Argentina, and Venezuela combined, and its economy is about to surpass Spain’s. If you include illegal transactions, Mexico already has the largest economy in the Spanish world by far. Along with (or perhaps instead of) Portuguese-speaking Brazil, Mexico could potentially help Latin America to become one of the most prominent regions in the world during the decades ahead.

Mexico may not be a major beneficiary of low energy prices, for three general reasons. First, it is a net oil-exporting economy: oil exports accounted for an estimated 2.7% of Mexico’s GDP in 2014, and Mexico had been hoping to increase its oil and gas production since its president enacted widely-touted reforms in the country’s energy sector that year. Mexico is also often a relatively high-cost oil producer, and so may be forced to cede market share to more price-competitive producers in other countries.

Second, Mexico has ties – both existing ties and potential future ties – to other countries in Latin America, a region that is highly economically dependent on exports of energy and other natural resources. Most of the South American economy is already in or flirting closely with recession as a result of the commodity crash, which on the whole is probably not a good thing for Mexico.

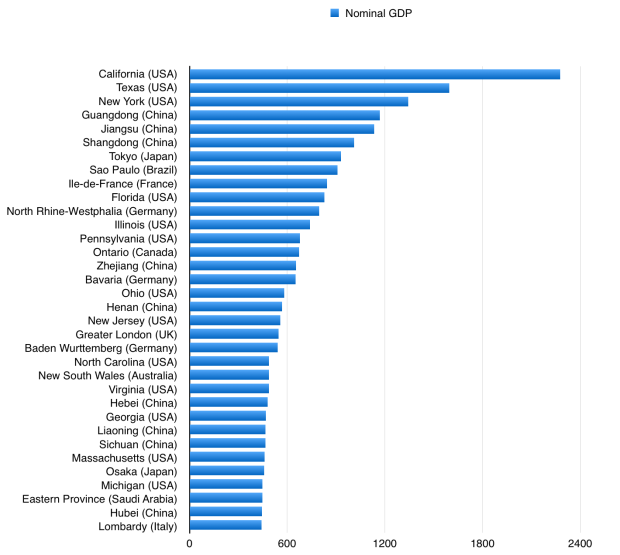
Third, Mexico has ties to the southwestern United States, in the areas of America that were part of Mexico prior to the 1830s-1850s, most notably California and Texas where around 25 million Hispanic-Americans live today. Like Mexico itself, this part of the US is dependent on energy exports, led by Texas (a major producer of oil, gas, coal, wind power, solar power, and refined petroleum products: Texas produces approximately one-fifth of US energy and one-third of US crude oil) but also including the surrounding energy-producing states of Oklahoma, Colorado, New Mexico, Utah, Louisiana, Arkansas and the federally-administered oil-and-gas producing waters in the Gulf of Mexico.

Nearly all of the states with a high share of Mexican-Americans are either energy-exporting states or else, in the case of California, New York, Florida, and Arizona, have the lowest per capita energy consumption of any states apart from tiny  Rhode Island, Hawaii, and Connecticut.

Even California’s energy imports do not balance out Texas’s energy exports, because California is itself the US’s third largest oil-producing state, tenth largest energy-producing state, and has the fourth lowest per capita energy consumption; its energy imports are not as large as one might expect given the enormous size of the Californian economy. They might even shrink in the future, if the Monterrey basin shale resources are developed. California is also the largest agricultural producer in the United States (Texas is fourth), a big sector that can be hit by falling commodity prices as well.

Mexico has admittedly been benefiting from cheap gas prices brought on by Texas’s shale boom.  Mexican imports of US gas have nearly tripled since 2009, which has benefited the industrial sector in northern and north-central Mexico. This gas import growth might slow going forward, however, as America’s LNG export facilities may soon be coming online, LNG import facilities in both Europe and China are expected to be opened soon, and the Panama Canal expansion which will be finised this year may allow LNG ships to traverse the canal from Texas to Asia for the first time. As LNG allows US gas to be sold worldwide, Mexico’s import growth of US gas might slow down. In any event, Mexico is the 19th largest natural gas producer in the world, so even with increasing imports from the US it will not soon become a significant net importer of natural gas.

In the future, meanwhile, somewhat similar to China, Mexico’s industrial growth may not be as strong as most people expect, which could cause it to become less dependent on energy and other commodity imports relative to other countries. Mexico is currently a major industrial economy, the result of its large and cheap labour force and proximity to US consumers. As labour and other prices in northern and to a lesser extent central Mexico are becoming more expensive due to economic growth in these areas, however, Mexico’s industrial growth rate may slow. This is because central and especially southern Mexico are separated from the US by vast areas of mountainous deserts or jungles, making the north-south roads and pipelines through Mexico expensive to build, use, and maintain, as well as potentially vulnerable to groups like the drug cartels, indigenous peoples, or local governments. Southern Mexico resembles Central America more than it resembles northern Mexico.

Mexico may increasingly also have to face industrial competition from Cuba, which is the only other sizeable Hispanic country close to the United States; from Venezuela, if it too can finally mend fences with America and leverage its energy resources to industrialize; or from Canada and the US, if they try to use robots and other technologies to re-industrialize. If, finally, domestic politics lead the US to try to make the Mexican border more of a barrier, Mexico might have to industrialize less and stick more to the many other sectors of the diverse Mexican economy, which are less resource-intensive.

Europe 

There is a fourfold division in Europe, where energy and commodity imports are concerned. First is between mainland Europe, which is a major importer of energy and oil, and the regions surrounding mainland Europe (namely Scandinavia, the North Sea, the former Soviet Union, the Middle East, North Africa, western Africa, and the Americas), which are energy and commodity producers. Even the United States has now become such a big energy producer that its energy imports account for only around 15% of its overall energy consumption, a very low share in comparison to an estimated 62% in Germany, 71% in Spain, 77% in Italy, 46% in France, and 43% in Britain.

Second is between countries which use the Euro as their currency – Germany, Spain, France, Italy, Greece, Slovakia, etc. – which tend to be significant importers of oil or other commodites, and countries that do not use the Euro – Norway, Sweden, Switzerland, Britain, Denmark, Poland, Romania, Czech Republic, Ukraine, Belarus, Russia, etc. – which tend to produce a decent amount of oil, energy, or other commodities — or else, like Switzerland, have economies that are not energy-intensive and so may not benefit as much from cheap energy. (Switzerland, the 20th largest economy in the world, also relies on imports for just 52% of its energy, according to the World Bank, which is a lower share than in all but four of the 19 countries within the Eurozone). Admitedly there are a few exceptions to this rule: most notably Turkey, which imports a lot of energy but does not use the Euro, and Estonia and to a lesser extent the Netherlands, which produce a decent amount of energy domestically yet do use the Euro. Still, even the Netherlands is a major net importer of crude oil.

The third division is between countries that are in the European Union and European countries that are not in the European Union. This division is similar to the Eurozone one, except that states like Britain, Denmark, Poland, Romania, and Sweden — all of which are mid-sized energy or commodity producers – are in the European Union but do not use the Euro, which leave the continent’s major commodity and enegy producers of Norway, Russia, and Ukraine as more prominent outsiders. Turkey, meanwhile, is, unlike Russia, Switzerland, Norway, or Ukraine, a member of the quite important European Customs Union, though like them it is not part of the EU.

Finally, and in some ways most pertinently, there is a division between northern Europe and southern Europe. The further north you go, the less dependent the Europeans are on energy imports. Scandinavia and Russia are the furthest north: they are major energy and commodity producers. (Even the three Baltic states, which are generally assumed to be among the smaller countries in Europe, actually own far more land per capita – and especially forested land, which is crucial for feeding Europe’s sizeable wood-fuel industry – than any European countries to the south of them do).

These are followed by countries like Britain, the Netherlands, Romania, Ireland, the German economies, Poland, the Czech Republic, Slovakia, Hungary, Belgium, and northern France, which have economies that are also not too dependent on energy imports. (Like Switzerland, both Ireland and northern France have economies that are not at all energy-intensive, when compared to others).

In southern Europe, finally, there are the economies of Spain, Portugal, Greece, Italy, France-sans-Paris, Turkey, Cyprus, and Malta, which are highly dependent on imports of oil, natural gas, and energy in general. (While nearby Algeria remains a large energy-exporting state and Libya has energy-export potential, Morocco, Israel, Lebanon, and Jordan are highly dependent on energy imports and Egypt and Tunisia are both more or less energy neutral). Perhaps not incidentally, most of southern Europe has experienced an economic depression during the past eight years.

The biggest exception within southern Europe, meanwhile, is Italy, which produces more oil than France, Greece, Turkey, and Spain combined, slightly more oil than even Germany produces. This may in fact partly help to explain why Italy has been suffering a great deal of late, whereas the Spanish, Portuguese, and possibly even Greek economies might finally be on the mend. Even Italy is the world’s third largest gas importer, however, so as with Spain, Portugal, Turkey, and Greece, the Italians depend on imports from abroad to supply more than 70% of the energy they consume.

Turkey

Turkey is in the most interesting position of all when it comes to energy and geopolitics. It, along with its nearest European neighbour Greece, is a significant net energy importer; Turkey has a relatively energy-intensive economy and energy imports account for three-quarters of its energy consumption, while in Greece energy imports account for 60% of energy consumption. Oil imports in Turkey and Greece were estimated to be equal in value to 3.2% and 4.5% percent of GDP in 2014, respectively, both figures quite a bit higher than in most other countries within Europe.

Surrounding Turkey and Greece, however, is a ring of leading energy-producing regions: the Middle East, Russia, Ukraine, the Caspian Sea-Central Asia region, and North Africa. Even Turkey’s closest Western neighbours of note, namely Italy, Romania, and Austria, are not necessarily going to benefit much from cheap oil or cheap energy. Italy produces nearly three times as much oil as Turkey does, Romania produces nearly twice as much oil as Turkey and depends on energy imports for just 22% of its energy consumption, and Austria has the lowest oil-imports-as-a-percent-of-GDP of any country in the Eurozone. Even Israel, Cyprus, and Egypt have made major new energy discoveries of late, of natural gas within the Eastern Mediterranean.

In past years, Turkey has already seen many of its neighbours fall to shambles to one extent or another — first the Soviet Union, Yugoslavia, Lebanon, Algeria, and the Caucuses in the 1990s, now Iraq, Syria, Ukraine, Greece, Georgia, and Libya, among others. Further troubles in the regions surrounding Turkey, then, perhaps brought on by the falling price of energy, could create a serious power vaccum for the Turks to consider filling.

Turkey’s close-to-home rivals the Kurds, meanwhile, are also potential losers in a cheap energy environment. They produce a lot of oil in Iraqi Kurdistan, abut a number of hydropower facilities located within Turkey’s mountainous Kurdish regions where the headwaters of the Tigris and Euphrates rivers form, and possess ties in some cases to energy-rich Iran (as a result of the Kurdish population in Iran as well as the fact that Persians tend to be ethno-linguistically closer to most Kurdish groups than most Kurds are to either Turks or Arabs) or to energy-rich Iraq (as a result of the sizeable Kurdish population that lives in Iraq).

India 

India, like China, is both a major energy producer, the seventh largest in the world, and a major energy consumer, the third largest in the world. In India, however, oil imports were equal to 5.3% of GDP in 2014, compared to just 2.4% in China, while energy imports accounted for 33% of Indian energy consumption, compared to just 15% for China. And whereas in China the areas that benefit the most from cheap energy are located outside of the Chinese political heartland, in India the country’s political core territories — which are centred around India’s largest state by far, namely Uttar Pradesh (population 200 million), as well as parts of its neighbouring states like Bihar (India’s third largest state), Madhya Pradesh (5th largest), Rajasthan (7th largest), and Delhi (India’s capital city, population 17 million) — may benefit among the most in India from falling oil and energy prices.

Some of the other areas within India, on the other hand, such as parts of both Western India (which produces 75% of the oil from onshore fields in India, and which has close economic ties to the nearby energy-rich Persian Gulf) and Eastern India (which is where most of India’s coal and other commodities are produced or exported), might not benefit in the same way*.

[*when I say “benefit”, I mean it in the geopolitical sense of the term, not in the ethical sense. From an ethical point view, for example, the fall in energy and commodity prices is arguably great news for many of the people in Eastern India who were being exploited because of their coal and mineral wealth. Obviously, things like this are usually far more complicated in reality than can be captured in any single essay].

India’s geopolitical dream is of a prosperous, peaceful Indian Ocean basin in which it, by virtue of its size, diversity, and central location, would be far and away the most prominent and powerful country. In order to accomplish this India must have better relations with Pakistan, a country that has been backed by the United States as well as by fellow Muslim states like Saudi Arabia. With the Saudis and other Sunni Muslim countries hurt by cheap oil and energy prices, and with India’s traditional allies against Pakistan, namely the Russians and Iranians, hurt by cheap energy too, both India and Pakistan might perhaps be forced to rely more heavily on the Americans. If, then, the Americans decide to prioritize India-Pakistan peace-making as a way to maintain stability in South Asia and help to contain forces like China, Russia, and pan-Islamism, there may be some cause to be hopeful. Don’t be too sure though: there are plenty of reasons why India, Pakistan, and the United States might each find it difficult to pursue Indian-Pakistani or Hindu-Muslim reconciliation.

Within the wider Indian Ocean region, stretching 6000 km from Madagascar to Indonesia and 6000 km from Sri Lanka to Kerguelen, there is also some scope for careful optimism. In East Africa, from around Ethiopia south through the Great Lakes, most economies are not dependent on energy exports in the way that western African countries like Angola, Nigeria, Algeria, Congo, Gabon, and Equatorial Guinea are. Even South Africa, the world’s sixth largest coal exporter, is not nearly as dependent on energy exports as Nigeria, Angola, or Algeria are, and is a net importer of crude oil. Oman and Yemen, similarly, the two Arab countries with coastlines directly along the Indian Ocean, are not nearly as dependent on energy exports as other Arab countries like Saudi Arabia, the UAE, Qatar, and Kuwait are. They, especially Yemen, may also be leading importers of food.

In the eastern Indian Ocean, the Indonesian islands of Sumatra and especially Java (combined population: 195 million) tend to be energy-importing areas, in contrast to Indonesia’s Pacific islands like Kalimantan and, 3500 km to the east of the Indian Ocean, West Papua, which account for most of Indonesia’s energy production as Sumatra’s aging oil fields are declining. In Indonesia’s neighbour Malaysia, similarly, most oil production comes from around the Pacific island of Borneo, an island Malaysia shares with Indonesia and Brunei, rather than from the Malay Peninsula on the edge of the Indian Ocean where most of Malaysia’s population lives. Singapore, moreover, which is located roughly in between western Malaysia and western Indonesia, is the world’s 13th or 14th largest oil importer (it is roughly tied with Thailand, which is also located along the outer edge of the Indian Ocean); in spite of its small size Singapore now imports nearly twice as much crude oil as Indonesia and Malaysia combined export to the world.
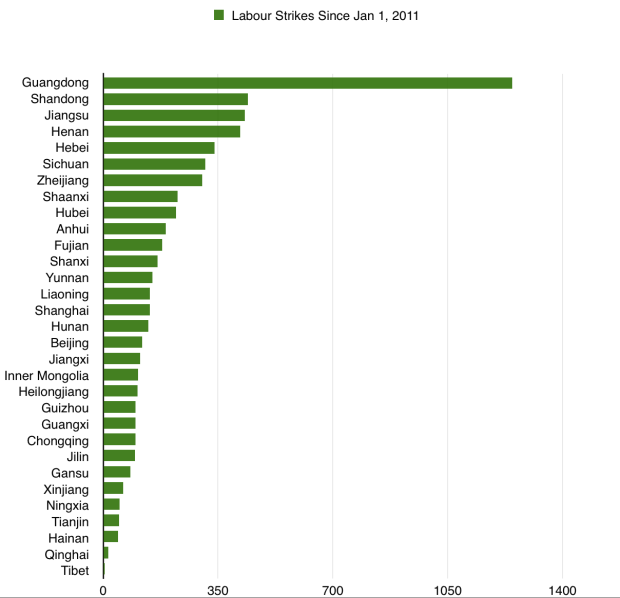
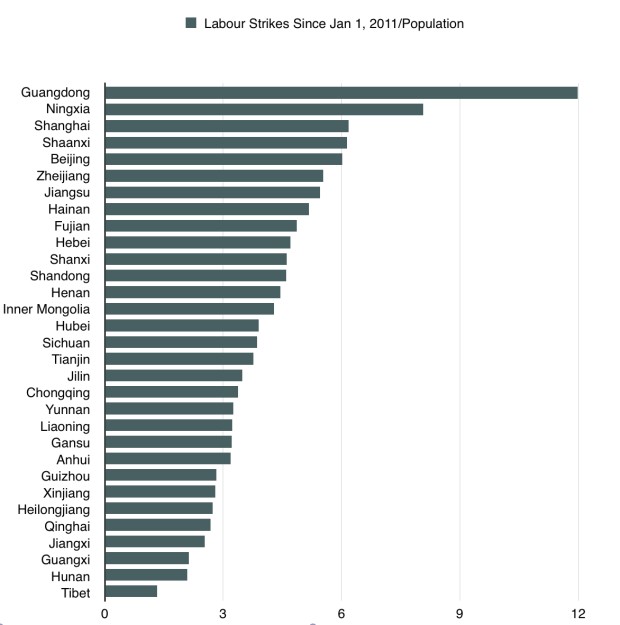
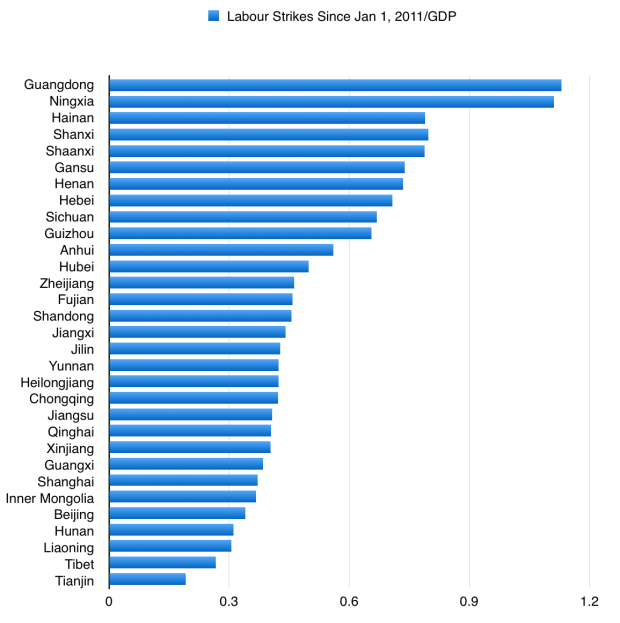
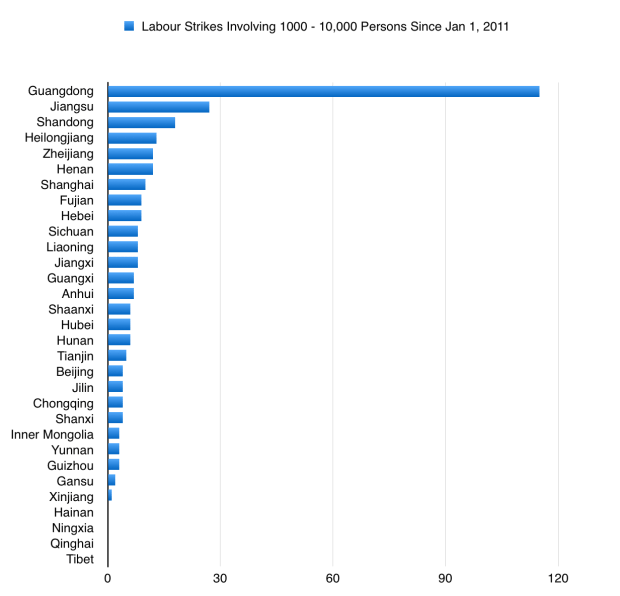
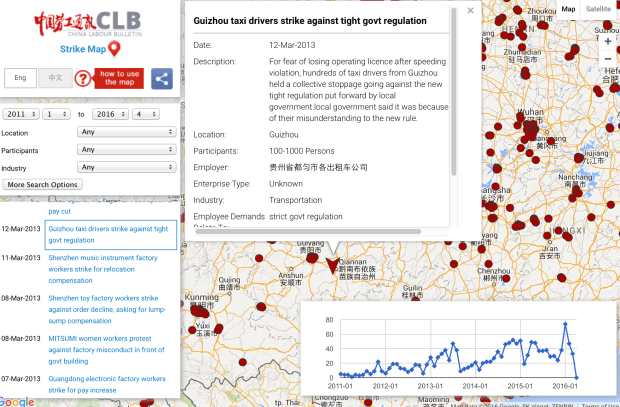
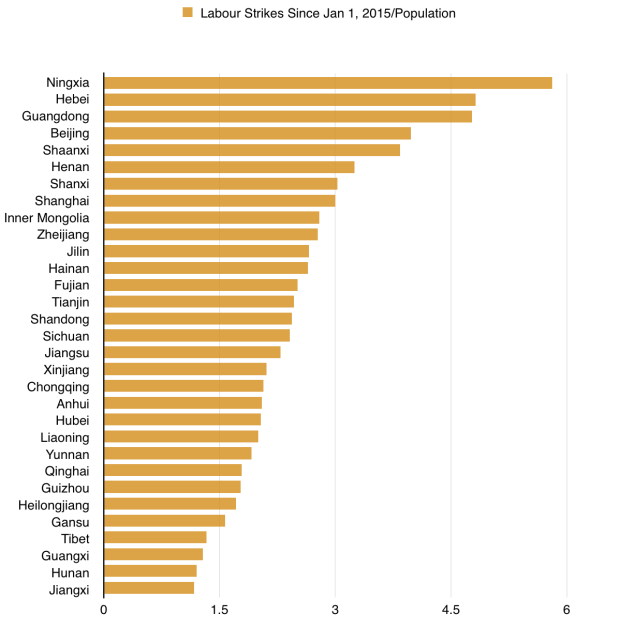
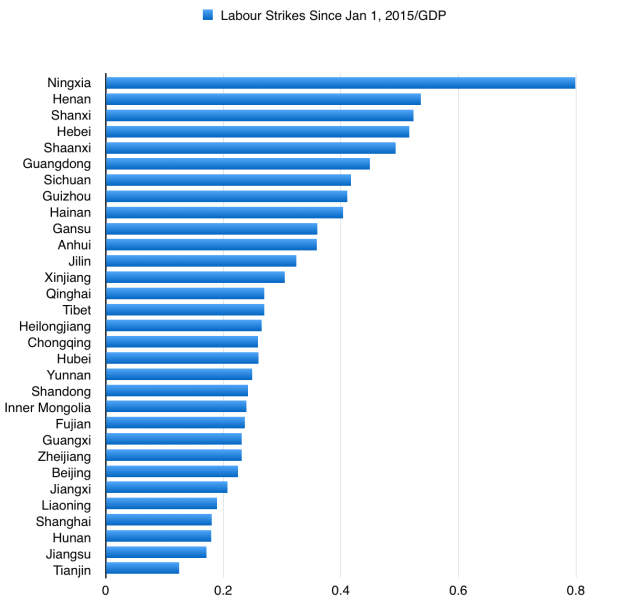
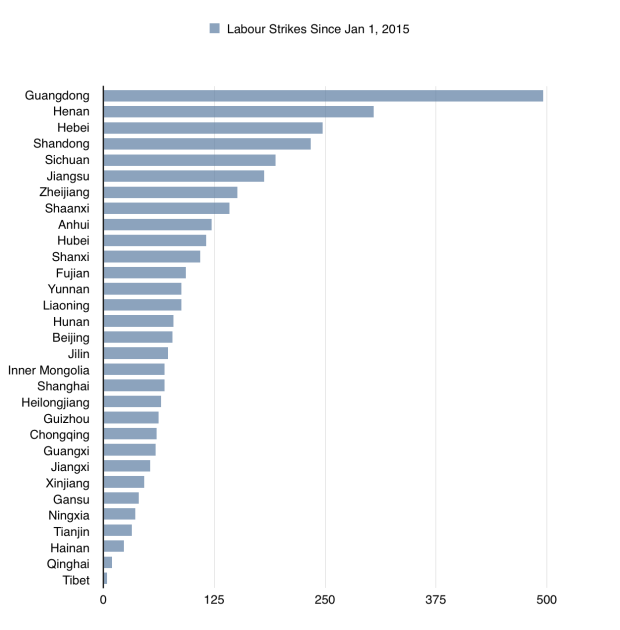
China’s Hidden Regionacracy, part 1: China’s Borderlands

chinese_provinces-mapChina_density-popChina_topo1941_China_from_the_East

How can one measure China’s economic stability? In the West, it is common to look to Hong Kong and Tibet as litmus tests of the strength of the central Chinese government. While it is true that both Hong Kong and Tibet are very important places, their combined populations do not account for even one percent of China’s overall inhabitants.

To get a better sense of China’s stability, then, one must also examine the other areas of China where the dictates of the central government are most likely to be resisted. Arguably, these include the following six regions: Southwestern China (namely, the provinces of Yunnan and Guizhou, plus the “Autonomous Region” of Guangxi), Southeastern China (the provinces of Guangdong, Fujian, and Hainan), Northeastern China (the provinces of Heilongxiang and Jilin), the Sichuan plateau (the province of Sichuan and “Direct-controlled Municipality” of Chongqing), and the “Autonomous Regions” of Xinjiang and Inner Mongolia.

These regions have a total population of over half a billion. They are home to a majority of China’s 120 million or so ethnic minorities, 300-400 million speakers of languages other than Mandarin, tens of millions of speakers of dialects of Mandarin that are relatively dissimilar to the Beijing-based standardized version of Mandarin, 20-30 million Muslims, 50-100 million recent adopters of Christianity, and tens of millions of family members of the vast worldwide Chinese diaspora.

Together, these regions form a cordon around the flat, triangle-shaped Chinese heartland that extends for more than a thousand kilometres from Beijing to Shanghai, where most of the rest of China’s population lives. Several other provinces, meanwhile, such as Shanxi, Gansu, Hunan, and the Hui Muslim “Autonomous Region” of Ningxia, arguably fall somewhere in between China’s central and peripheral territories, from both a geographical and political perspective.

Along with the high-altitude Tibetan(-Qinghai) Plateau and the Chinese Himalayas, these six peripheral regions possess by far the most rugged, expansive, and insular terrain within China. Their territories consist either of:

  • subtropical hills and mountains (throughout most of Southeastern and Southwestern China)
  • vast semi-desert plateaus (in Xinjiang and Inner Mongolia)
  • enormous mountains (in Xinjiang, where mountains cover an area larger than England and regularly reach heights higher than the highest Rockies)
  • mountainous or hilly islands (within the archipelagic coastal waters of Southeastern China, in places like Hong Kong, Macau, Hainan province, Xiamen, Zhoushan, Pingtan County, and nearby Taiwan)
  • mountain-enclosed riverlands (in Sichuan and Northeastern China)

Not surprisingly, Chinese central governments, whether they are controlled by ethnic Han Chinese as is the case today, or else by outside invaders like the Manchu or Japanese as was the case for most of the past half-millenium, have almost always had trouble subduing most or all of these areas.

Indeed, China’s peripheral regions contain all of China’s land borders, which are the longest in the world, more than two thousand kilometres longer than all of Russia’s land borders and well over double the length of the continental United States’. These borders remain almost impossible for the Chinese government to fully control, not only because of their incredible length and difficult terrain, but also because they are located an average of between one and a half thousand and three thousand kilometers away from the Chinese heartland. Only two significant railway lines cross the western half of this enormous distance as of yet.

Complicating matters further, China’s borders are shared with fourteen different countries, nearly all of which possess either ethnolinguistic or religious ties with the areas of China they are adjacent to. These include:

  • the long Himalayan border that separates Tibet from India, Nepal, and Bhutan, across which the exiled Tibetan Buddhist leadership resides
  • the even longer border that seperates Inner Mongolia (where more than one-fifth of the population are ethnic Mongols) and Xinjiang from the country of Mongolia (which in turn shares a three and a half thousand kilometer-long border with Russia)
  • the Manchurian-Korean border, where China is terrified of millions of refugees flowing in from North Korea in the event of a disaster there, and where nearly two million people living in the Manchurian provinces of Heilongxiang and Jilin are already Korean
  • the twin Siberian borders with Xinjiang, Inner Mongolia and Manchuria; Xinjiang’s borders with Khazakstan, Kyrgystan, Afghanistan, Pakistan, and Kashmir, where, as in Xinjiang, a plurality of the population is Muslim and/or ethnolinguistically Turkic
  • the southeastern and southwestern Chinese borders with Southeast Asia, throughout which there is a diaspora of tens of millions of southern Chinese, and where ethnic minority populations span both sides of China’s borders with countries like Myanmar and Vietnam.

As the economies of these peripheral Chinese regions as well as China’s neighbouring countries emerge, as in recent years many have begun to do at a faster pace than the Chinese economy has as a whole, they may deepen this array of cross-border relationships, and in turn could undermine efforts by China’s central government to enforce national unity within the huge Chinese economic and political system. The Chinese have certainly been worried about their neighbours within the relatively recent past: China sacrificed hundreds of thousands of its citizens during the Korean War in the 1950’s and then thousands during the Sino-Vietnam War in 1979, which, as a point of comparison, may be more casualties than the United States has suffered in all of the wars it has ever fought put together.

Since the 1980’s, however, as the China-US alliance took root and the Chinese economy began rapidly expanding, and as the economic growth of most of China’s neighbours collapsed in the early 1990’s (Japan and the Soviet Union), late 1990’s (South Korea, Taiwan, Southeast Asia, and British-era Hong Kong), or during the the 2008 global recession (Russia, Japan, Taiwan, Europe, and North America), while around the same time the power of China’s English-speaking rivals became preoccupied with Afghanistan and Iraq throughout the 2000’s, China has not had to worry about its borderlands nearly so much.

This is not to say that these regions were problem-free during this period. The Chinese government has in fact been concerned with many of them, including, for example:

Yet all such risks proved to be manageable ones, eased as they were by the amazing Chinese economic boom that was then still in full swing, and by the fact that China, which until 2010 still had an economy thought to be smaller than Japan’s, had not yet attracted the full attention of other powers intent on containing it.

Lately, in contrast, just as the United States has been disengaging from Afghanistan and Iraq and the economies of the US and Britain have begun speeding up again following their multi-year post-recession slog, and just as Japan, which continues to have the third largest economy in the world by a large margin, has finally begun to rebuild its will to implement an aggressive economic stimulus program and outwardly post-pacifistic foreign policy, many of China’s peripheral provinces and most of the countries surrounding China either grew or accelerated their economies at a faster pace than did the overall Chinese economy, which has slowed significantly in recent years.

In some of these areas, for instance on both sides of the border between south-western China and northern and eastern India, growth in 2014 accelerated at a much faster pace than in China as a whole. While China’s overall economic growth nevertheless remains quite strong compared to most of the rest of Asia and the world – at least, according to Beijing’s own official estimates, which admittedly are dubious – this constellation of recent trends does not bode well for its central government going forward.

Internal Chinese Geopolitics, part 1

How can one measure China’s stability? In the West, it is common to look to Hong Kong and Tibet as litmus tests of the strength of the central Chinese government. While it is true that Hong Kong and Tibet are important places — Hong Kong because it one of China’s major financial and service centres, Tibet because it encompasses around 15 percent of China’s territory and contains the headwaters of China’s, India’s, and Southeast Asia’s most important rivers — the inhabitants of Hong Kong and Tibet do not even account for 1 percent of China’s overall population.

To get a better sense of China’s political stability, then, one must also examine the other areas of China where the dictates of the central government in Beijing are most likely to be resisted. Arguably, these include the following seven areas: the Sichuan basin, Southwestern China, Southeastern China, Northeastern China (formerly known as Manchuria), the Shanghai Municipality, and the “Autonomous Regions” of Xinjiang and Inner Mongolia.

With the exception of Shanghai, not a single person born in any of these areas has become the ruling General Secretary of the Communist Party of China or the Premier of the People’s Republic of China. And yet, taken together, these areas have a population of almost 600 million people – close to half of China’s total population. So, let’s take a brief look at each one of them:

The Sichuan Basin –  Population: 111 million

See that red circle in the centre of China’s population density map (pictured below), and the greenish-yellow circle in the centre of China’s physical topography map (pictured below that)? That is the Sichuan basin, which consists of the province of Sichuan (population 81 million) and the city-state of Chongqing (population 30 million).

2BCKPUB

Topographic-map-of-China-2005

Close up topography of the Sichuan basin and surrounding areas: 

Physical map of Sichuan.

To the west of the Sichuan basin is the sparsely populated Tibetan plateau, which is more than 4000 metres higher above sea level than Sichuan is (to put that into context, the tallest building in Manhattan is only 540 metres tall). South and southeast of Sichuan there are mountains and plateaus that are about 1000 metres higher than Sichuan. To the east there are also mountains, which separate Sichuan from the middle reaches of the Yangtze River valley, where the elevation is about 350 meters below that of Sichuan. And to the north there are a series of high mountain ranges and narrow valleys that have historically helped to insulate Sichuan from the northeastern coastal plain where most Chinese people live.

The Sichuan basin’s geographic insularity and large population (larger than any single Chinese province) have historically made it one of China’s more independent-minded regions. In the 3rd century AD, for instance, during China’s famous Three Kingdoms era, a state basically corresponding to modern-day Sichuan was one of China’s three independent political entities (see left map below). A somewhat similar thing occurred in the 10th century AD (see right map below).

250px-China_5Five_Dynasties_Ten_Kingdoms_923_CE

More recently, Sichuan played a significant role during the Xinhai Revolution just prior to WW1, which overthrew China’s last emperor, and during the “Warlord Era” which followed it. Sichuan then became a critical component of the Communist Party’s rebellion against the ruling Chinese Nationalists during the Chinese Civil War from 1927 – 1950. Mao’s infamous “Long March” went through the outskirts of Sichuan province, for example, and one of the two largest original Communist armies during the Civil War, led by Mao’s rival Zhuang Guotao, was based there as well. Finally, after the Communists turned the tables on the Nationalists, gaining the upper hand in the Civil War, Sichuan ended up becoming the last base of the Chinese Nationalist leadership prior to its retreat to the island of Taiwan in 1949.

mainmap

Sichuan, in other words, often became a centre of resistance against whichever group, whether Chinese or foreign, happened to be ruling China at the time. Indeed, when the Japanese controlled much of China during WW2, Chongqing even became the official capital city of the parts of China that were still free of Japanese control (see map above). Much more recently, during the protests of 1989, there were actually two, rather than just one, major government crackdowns: one in Beijing’s Tiananmen Square, which most people in the West have heard of, and the other in Sichuan’s capital city of Chengdu, which very few people have heard of.

While it is difficult to speculate on the extent to which the Sichuan region may become a nuisance for China’s central government in the future, there have arguably been some troubling signs of late. Most notably, the two most prominent “purges” of high-ranking Communist Party leaders in recent times were both from the Sichuan basin.

The first was Bo Xiliai, the leader of Chongqing, who many had thought might become China’s next top leader, but instead was exiled from the Communist Party and given a life sentence in prison on a corruption charge in 2012, following a curious, alleged incident involving his wife, the Chongqing chief of police, and the murder of a British businessman.

The second was Zhou Yongkang, the former leader of Sichuan province, who was arrested on corruption charges in late 2014, only a few months ago, becoming the first member of China’s seven-person Politburo Standing Committee (the top leadership of the entire country) to be expelled from the Party since the 1980s. Many of Sichuan’s other top leaders have recently been targeted by the central government on corruption investigations as well, because of their associations with Zhou. Of course, the fact that Bo and Zhou were both the most powerful modern leaders the Sichuan basin has seen might just be a coincidence, having more to do with personal politics within the Communist Party than regional geopolitics within China as a whole. But it is somewhat suspicious nonetheless.

201301291057565481

Politically, in spite of the region’s large population, not one person born in Sichuan or Chongqing currently holds a position in any of the 43 positions in the Communist Party’s Politburo, Secretariat, or Central Military Commission, at or around the top levels of China’s political hierarchy.

And yet, all of the previous recent Communist Party leaders of Chongqing (none of whom were actually born in the region) have gone on to some of the top jobs in the entire country. Three of the past four have even become members in China’s Politburo Standing Committee, the 7-man group which de facto holds the highest Party positions of all. And before them, Deng Xiaoping, by far the most infamous post-WW2 Chinese leader apart from Mao, served as Mayor of Chongqing, and was born in one of its suburbs. (Though in Deng’s day Chongqing was more important in China than it is today, since its insular location had allowed it to serve as the capital city of “Free China” during the Japanese occupation of eastern China in WW2).

The promotion of former party chiefs of Chongqing (but not Sichuan, even though Sichuan is much larger) to top positions in the central government in Beijing might also be just a coincidence. It does, however, seem suspiciously like a divide and conquer tactic the government has been using to keep Sichuan and Chongqing apart, by winning Chongqing’s favour. Chongqing holds a particularly strategic position, as it is the spot where the Yangtze River flows out of the mountain-enclosed Sichuan basin, entering into the rest of central China and eventually reaching Shanghai on the Pacific.

Indeed, the reason Chongqing was even made a city-state to begin with — one of only four city-states within mainland China, the others being Beijing, Shanghai, and Beijing’s port city of Tianjin — may be because China’s leaders were worried about having to deal with a politically united Sichuan basin, which prior to Chongqing’s independence from Sichuan in 1997 had been China’s most populous province. This is probably also why the “Municipality” of Chongqing, unlike those of Shanghai, Beijing, or Tianjin, is the only one to have been given large rural areas around it to govern, so that it controls a population of 30 million even though its urban areas are home to around just 10 million.

The current Party chiefs of Chongqing and Sichuan are two of the youngest in the entire country. They are 51 and 58 years old, respectively; most other provincial party chiefs in China are in their sixties or seventies, and the 51-year-old Chongqing leader is actually the youngest of all 25 current members in the country’s Communist Party Politburo. Having the youngest provincial party chiefs or governors is usually not a good sign, since Beijing tends to pick the youngest, most ambitious governors for areas it is most concerned with, the idea being that such governors will be willing to do whatever is necessary in order to maintain order, so that they can later be promoted to one of the Communist Party’s highest offices. Hu Jintao, for instance, had served as the party chief of Tibet prior to becoming a major political figure. Indeed, we will continue to see the pattern of relatively young and ambitious party chiefs and governors in the other potentially trouble-making regions we will discuss in this article.

Finally, also notable is the Sichuan Earthquake of 2008. The earthquake, the epicentre of which was only about 80 km from Sichuan province’s main city of Chengdu (population 14 million), killed an estimated 80,000-90,000 people and caused an enormous amount of physical injury and property damage, leaving 5 – 15 million people homeless. It is one of the deadliest natural disasters in the world in modern times, and the deadliest in China in over three decades. By comparison, that is about 20,00 more casualties than the United States experienced in Iraq, Afghanistan, and Vietnam combined.

The Sichuan earthquake was mostly overlooked by people in the West, not only because it took place deep within the unknown Chinese interior, but also because it was overshadowed by a flurry of notable world events that took place during the months immediately following its occurrence, such as the global financial crisis, the first Obama election, the Beijing Olympics, the Russian invasion of Georgia, the first Israeli war against Hamas in Gaza, and the Mumbai terrorist attacks. The same week as the earthquake, in fact, California became the second US state to legalize same-sex marriage, and the debate discussion of this decision even got much more American news coverage than the disaster in Sichuan did.

The earthquake was, however, obviously an event of huge importance within China, and it is still quite fresh in some people’s minds. Its tenth anniversary will be approaching in 2017, the same year as China’s once-a-decade top leadership changeover. Crucially, many Chinese people believe that the central government are at least partly to blame for the earthquake (though it is difficult to know how many people believe this, given Chinese censorship). This is because the government created the gigantic nearby Three Gorges Dam, which finished being constructed just prior to 2008, and many think the weight of the dam – which can produce almost twice the electricity of any other dam in the world – and the reservoir of water it created was the catalyst for the earthquake. (Even before the earthquake, the Dam crushed the previous record for people displaced from their homes by a hydroelectric plant: the number of displaced Chinese was estimated at more than 1.2 million people, most of them from the province of Hubei, which directly borders the Sichuan basin).

And the thing about earthquakes is, of course, that you never fully know when another one is going to happen. If a second large one were to occur and affect Sichuan, it could bring back the memory of 2008 – and potential Sichuanese anger with the central government  – along with it. In fact, this may have already happened to a certain extent: China’s highest-magnitude earthquake since the Big One in 2008 occurred again in Sichuan, in 2013, only about 115 km from Chengdu. It killed an estimated 200 people (according to the Chinese government) and injured more than 10,000.

Southeastern China —  Population 154 million

350px-SoutheastChina

In a previous article, we discussed a large number of differences between southern China, where nearly all of the country’s tens of millions of ethnic minorities and hundreds of millions of linguistic minorities live, and northern China, where most of the country’s enormous majority of ethnic Chinese and Mandarin speakers live. So we will try to repeat only some of the basic facts of the region that were discussed there, and then focus specifically on why this part of China could potentially become the most problematic region for the Chinese central government to handle.

Southeastern China consists basically of three provinces: the province of Guangdong (population 107 million), which has the largest population and economy of any Chinese province, and which is the only province which borders Hong Kong; the province of Fujian (population 38 million), which is located directly across the 180 km long Taiwan Straits from Taiwan, speaks the same dialect of Chinese as is spoken in Taiwan, and, in spite of having less than 3 percent of China’s total population, accounts for perhaps 15 percent of all China’s trade with Taiwan (and China trades roughly 40 percent as much with Taiwan alone as it does with the entire US); and finally the province of Hainan (population 9 million), which is the only island province in China. The first bridge linking Hainan to the Chinese mainland (specifically, to Guangdong), is supposed to be finished between 2016 and 2020, and is likely increase Guangdong’s level of influence on the island.

As you can see from the population density map below, southeastern China is very different from northern China, in that its population centres are almost entirely situated on the country’s Pacific coast. The reason for this is that southern China, unlike northern China, has a very difficult climate and topography to deal with – it is extremely hilly, mountainous, often forested, and sub-tropical (see the other two maps below) – so that its population has moved to the only places where economic development was not extremely difficult to achieve, namely the narrow coastal flatlands that sit next to its numerous natural harbours.

China_density-pop

images

or, for a different perspective of the topographic differences between southeastern China and central-eastern China:

1941_China_from_the_East

Because southern China’s challenging geography has tended to impede internal movement of people and goods – especially in the past, but to a decent extent also in the present – southeastern Chinese coastal cities have also become relatively close to, and dependent on trade with, the outside world, with foreign economies like Japan, the United States, Canada, and Europe, as well as with Taiwan. The relationship between Hong Kong (population 7.2 million) and Britain is of course the most obvious and significant example of this, but it is not the only one. Macau (population 600,000), for instance, on the borders of Guangdong, is a former Portuguese territory that is China’s only “Special Administrative Region” apart from Hong Kong. Macau is also by far the wealthiest of any political subdivision within China, with a per capita nominal income of more than $90,000.

Pearl_River_Delta_Area

According to the Economist, Guangdong and Fujian alone account for 30-40 percent of all Chinese exports. Most of China’s gigantic global diaspora – which is 50 million strong, perhaps, and is located all over the world, but particularly in places like North America, Australia, Peru, and especially Southeast Asia – is also from Southeastern China. In fact, it has been estimated that one out of every seven Chinese Americans have their roots in the Guangdong area of Taishan, even though Taishan itself only has around 1 million inhabitants today. More recently, in the 1980s, emigrants from Taiwan and Hong Kong came to countries like the US and Canada in very large numbers. If, therefore, globalization forces continue to deepen, and if the economies of Southeast Asia and Taiwan continue to emerge, it could have a huge influence on this part of China, in a sense pulling it away from the rest of China.

Southeast Asia alone is home to an estimated 27 million Chinese people (though admittedly, these statistics vary widely depending on which numbers you trust, and on which criteria you use to define who is and is not “Chinese”, since many have been living in Southeast Asia for many generations now). Southeastern China also directly borders a potentially rapid-growing Vietnamese economy, the capital city of which, Hanoi, is only about 100 -150 km from the southeastern Chinese border, only 400 km from Guangdong’s enormous capital city Guangzhou and Hong Kong, and only 250 km from the Chinese island province of Hainan.

vietnam-map

Along with the adjacent provinces of Hunan, Jiangxi, and Zheijang, Southeastern China also has by far the most intra-Chinese linguistic diversity in the country. In it, non-Mandarin Chinese languages are spoken by an estimated 300 million people (though increasingly, most people are also able to speak the standardized, Beijing-region dialect of Mandarin) — see map below. Like Sichuan, this region has also been politically disenfranchised to a certain extent, with not a single one of China’s 43 positions in the Party’s Politburo, Secretariat, or Central Military Commission held by someone born in Guangdong or Hainan, and only one held by someone born in Fujian. Currently Beijing has also given Guangdong the second youngest party chief (aka party secretary) in the country, a 51-year-old who has spent most of his career working in Tibet.

240px-Sinitic_Languages0

Recently, this region has also been slowing economically as a result of the effect that Europe’s and Japan’s stagnant economies have had on demand for its exports. As a result, and also given the recent (and perhaps ongoing) protests in neighbouring Hong Kong, the province of Guangdong should be watched very closely at this time.

Historically, to be sure, Southeastern China has been a huge pain for Chinese central governments. From roughly 200 AD to 500 AD and from 1000 AD to 1200 AD, for example, there was a general north-south political divide in China (see maps below).

china 900 china 200

In modern times, during the anti-emperor Xinhai Revolution prior to WW1, Guangdong and Fujian were two of the original centres of the revolution. Later, in 1925, the Chinese Nationalists (the Kuomintang) set up an alternative Chinese capital city in Guangzhou, Guangdong, and from it successfully led a campaign to overthrow the government in Beijing, at which point the Chinese capital was moved to Nanjing (next to Shanghai).

Only a few years after that, in 1930, there was a very deadly civil war within China, the Central Plains War, which among other things pitted Nationalist leader Chiang Kai-Shek, who was ruling out of Nanjing, against Hu Hanmin, who had the support of the Nationalists across Guangdong and the rest of southern China. This rivlary had in fact been presaged by an earlier one in 1922, when the top Nationalist leader at the time, Sun Yat Sen, was forced to flee Guangdong from a different, more regional-minded Nationalist leader, Chen Jiongmin.

Around the same time, the Guangdong capital of Guangzhou was also one of the main bases of the Communist movement in China. The Communists were gaining momentum across various parts of southern China: in 1933, just to give one example, an alliance between a portion of the Communist movement and a portion of the Nationalist movement emerged, leading to the Fujian Rebellion: the creation a self-governing leadership in Fujian province that aimed to overthrow the Nationalist Chinese government of Chiang Kai-Shek. The provinces of Hunan and Jiangxi, directly on the border of Guangdong, also became very important for the Communists.

Finally, when the Communists took over and were about to win the Chinese Civil War, Guangdong became the final base – along with Sichuan – of the Nationalists prior to their retreat to Taiwan.

While it is probably unwise to make generalizations about Chinese history, there does seem to be a bit of a pattern here: Guangdong, or more broadly southern China, tends to resist centralized Chinese leadership. It has always seemed to lead the anti-government movements in the country, whether it be the anti-imperial uprising against the Qing Dynasty at the begining of the 20th century, the Nationalist move to overthrow the Beiyang government (which had replaced the Qing) in the Northern Expedition, the attempt by regional leaders within the Nationalist movement to get rid of the Nationalist central government of Chiang Kai-Shek that ruled out of Nanjing, the emergence of Communist movements opposed to the ruling Nationalists (with whom they had previously been allied), or, finally, the retreat and resistance of the Nationalists in the face of the ruling Communists.

chinese_provinces-map

The thing which makes southeastern China so potentially difficult for the central Chinese government, however, is not so much its history as it is its wealth. If you take Guangdong and Fujian, and add in neighbouring Taiwan, Hong Kong, Zheijang, and the Municipality of Shanghai (and we will discuss Shanghai later in part two of this article), you get a coastal region with a GDP that, as recently as 2009, was approximately 80 percent as large as the rest of all of mainland China’s other provinces put together.

Such wealth not only gives southeastern China economic influence, but has also made its internal politics complicated – and potentially dangerous – through the creation of divisions between the native inhabitants of the region’s cities, and the migrants from its rural areas and from the rural areas of poorer Chinese provinces, who are in search of work in its cities. Guangdong alone has an estimated 27 percent of China’s inter-provincial migrant population. And in China, “rural-urban” is not only a geographic or demographic distinction, but also a legal designation with significant  financial and social implications. Rural Chinese populations, even when they have moved to urban areas, are generally denied many of the social services, such as subsidized housing or education, which are provided for the native urban populations.

Finally, parts of central-eastern and southeastern China in recent years seem to have become the main centres of China’s potentially enormous transition toward Christianity. Today, according to the Economist, arguably more than 100 million people in China are Christian, up from perhaps as few as 15 million as recently as the 1990’s. If these numbers are accurate, then the growth of Christianity within China during the past two decades represents one of the largest religious adoptions in all of human history. The Economist more recently argued that the relationship between Christianity and the Communist Party in China has been becoming much more tense  in the past year.

Neighbouring Hong Kong has long had a significant Christian population, meanwhile, and remains around 10-15 percent Christian today. A number of the Hong Kong protest organizers were practicing Christians, in fact. And, notably, the Chinese government may have begun to crack down on parts of this growing Christian religion within China during the past year or so.

Southwestern China Population: 120 million

Southwestern China (containing the provinces of Yunnan, Guizhou, and the “Autonomous Region” of Guangxi, one of only two Autonomous Regions apart from Tibet, Xinjiang, and Inner Mongolia) is by far the most mountainous of any populous Chinese region. Partly as a result of this, it also has by far the most ethnic diversity in the country, with a regional population that contains tens of millions of non-Chinese peoples (most notably the 15 million or so Zhuang ethnic group), some of whose homelands extend across the Chinese border with Southeast Asian countries like Myanmar. Like the other regions discussed so far, southwestern China has historically been a challenge for Chinese central governments. During the 1950’s, for instance, in the largest southwestern province, Yunnan, an anti-Communist Islamic guerrilla insurgency took place, orchestrated in part by the Nationalists who were ruling Taiwan. Today, as in Guangdong or Sichuan, not one person who was born in southwestern China is currently serving within the highest echelons of the Chinese government.

se-asia-map_ethnicgroup

Southwestern China is the only part of China to border most of Southeast Asia. It could in the future become particularly close with the northern part of Vietnam, which is nearby, populous, and can serve as an alternative route for southwestern Chinese goods to reach the Pacific. It could also become close with Myanmar, which can serve as a direct route for it to reach the Indian Ocean via the commercially navigable Irrawaddy River (see map below), or to reach India and Bangladesh overland without having to cross the virtually impassable Himalayan Mountains and Tibetan Plateau (see other map below). Notably, Vietnam and Myanmar have seen a great deal of economic growth in recent years, and Myanmar has politically been re-opening itself to the West after decades of isolation. Economic interaction between Southwestern China and these potentially emerging countries could present some challenges for the Chinese central government.

mapasia

In addition, and also potentially troubling for the Chinese central government, the region of southwestern china also has ties to southeastern China via the Pearl River, which is by far China’s longest commercially navigable river apart from the Yangtze, and which meets the Pacific at the place where Hong Kong and Guangdong’s capital city of Guangzhou are located (see map below). Southwestern China also directly borders both Sichuan and Tibet.

Zhujiangrivermap

(In the graph above: Kunming, Guiyang, and Nanning are the capital cities of Southwestern China’s provinces. The Greater Guangzhou-Hong Kong area in Southeastern China, which has a total population of perhaps more than 50 million, is arguably the most populous urban area in the entire world)

In part two of this article we will take a look at Shanghai, Xinjiang, the former Manchuria, and Inner Mongolia.