The Birthplaces of China’s Leadership
Internal Chinese Geopolitics, part 1
The Geopolitics of Chinese M&A
North Korea and the Olympics Curse

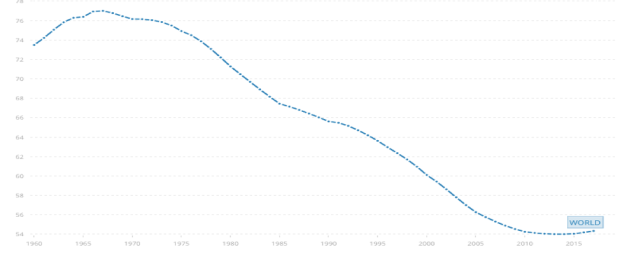
2008 was as significant a year from a demographic perspective as it was from a financial one. In 2008 the world’s age dependency ratio — the number of people who are either younger than 15 or older than 65, relative to the number of people aged 15-65 — reached its lowest point. From a peak of approximately 77 in 1967, the ratio fell to a floor of 54 in 2008, a level it has remained at every year in the decade since. This low is not likely to be surpassed. The UN predicts that the ratio will rise gradually during the generation ahead, as more Baby Boomers turn 65 and birthrates keep falling worldwide.
The age dependency ratio is a useful, though obviously imperfect, measure of economic potential. The larger a country’s dependency ratio, the heavier the economic burden (to put it crudely) its working-age population may need to bear. The country with the highest such ratio in the world, Niger, with a ratio of 112, has a burden 1.12 times as heavy as those who bear it. The country with the lowest dependency, South Korea, with a ratio of 38, has a burden that is only about a third as heavy as those who carry it. The Gulf Arab kingdoms have even lower ratios than that (the UAE’s is just 18!), but only because they have so many temporary foreign workers.
It is not surprising that a lower dependency ratio tends to correlate somewhat with economic success. Not only is a country with fewer dependents more able to invest its time and money in increasing its productivity, but productive countries also tend to have low fertility rates, which keep dependency levels low in the short-term (though not in the long term, when low fertility rates lead to small working-age populations). As such, a low dependency ratio can be both a cause and an effect of economic growth. Even the oldest country in the world, Japan, only has a dependency ratio of 66.5, much lower than those of the young countries within Sub-Saharan Africa.
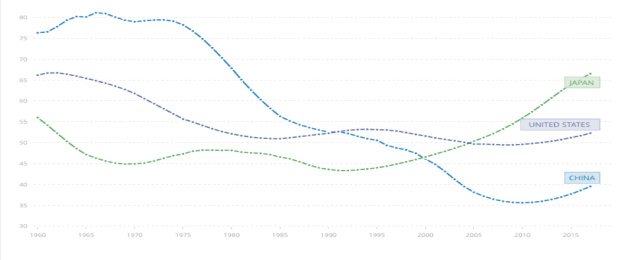
In recent history, the correlation between economic growth and age dependency can be seen most clearly in East Asia. China’s rapid economic growth has tracked its dependency ratio’s steep fall, while Japan’s stalled economic growth has tracked its own dependency ratio’s rise. China’s dependency ratio, which is today the lowest in the world apart from South Korea (not counting city-states or the Gulf Arab monarchies), was almost twice as high a generation ago, and only fell below the US’s in 1990. That same year, Japan’s ratio fell below Germany’s to become the world’s lowest other than Singapore or Hong Kong. A rapidly aging population has since made Japan’s become by far the highest in the developed world, however. Japan’s ratio has also risen higher than those of many developing nations in recent years, even than some of the world’s poorest nations, such as Haiti.

Outside Japan, East Asia now has the lowest dependency ratios of any region, by far. Not only China and South Korea but also Thailand, Taiwan, Singapore, Hong Kong, Vietnam, Malaysia, and even North Korea all have ratios between 38-44, the lowest in the world anywhere outside of the Persian Gulf. Indonesia’s too, at 48.5, is now lower than those of most countries in the world, while the Philippines, the major outlier in the region with a dependency ratio of 57.5, no longer has a high ratio by global standards either. This trend, however, is finally beginning to change. China’s ratio has begun to rise since 2010, prompting many to worry that the country “will become old before it becomes rich”. The dependency ratios of Vietnam, Thailand, and South Korea have also begun rising during the past several years. And Japan’s already high ratio will continue to rise quickly unless it finally decides to raise its extremely low immigration rate.
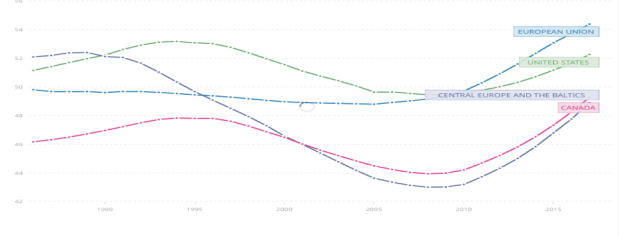
The years 2008-2010, in addition to being when the global dependency ratio and the Chinese dependency ratio both reached their lowest levels, was also when the EU’s dependency ratio rose higher than that of the US, for the first time since 1984. The EU’s dependency burden has continued to rise relative to the US in the decade since, a fact that has perhaps contributed, at least to a minor extent, to the US’s stronger economic performance during this period. Indeed, at the risk of attributing far more significance to the age dependency ratio than is justified, I will also point out the fact that countries in Central Europe have enjoyed a much lower ratio and a much stronger economic performance than has the EU as a whole. Similarly, Canada has had the lowest dependency ratio and one of the strongest economies among rich Western nations in recent years. Ratios in Canada and Central Europe were particularly low during the financial crisis:
Another intriguing case is Italy, which has a ratio that has been rising at fast pace since 2010, reaching the highest level in its modern history in 2017, at the same time as its economy has become perhaps the primary point of concern in European politics. A similar trend has existed throughout Southern Europe, with the ratios of Greece, Spain, and France reaching high levels in the years after 2010. Although it is actually France which has the highest dependency ratio of these countries, a result of its having a relatively large population of children, it is Italy which has their highest old age dependency ratio (population older than 65, relative to population 15-65):

If we look at Europe as a whole, including countries in its surrounding region, we can see there is a divergence occurring between northern and southern countries. Northern countries such as Germany, Russia, and Poland, which have had some of the lowest dependency burdens in the world in recent decades, will see sharp increases in the years ahead because their largest population cohorts are approaching 65 years old and they have few teenagers approaching 15 years old. (An exception to this is Ireland, which has had a fairly high ratio because of relatively high birth rates, but is not likely to have this increase much going forward, as it has few people approaching 65). Mediterranean countries, in contrast, will have their dependency ratios rise more slowly, because they have more children or because (particularly in Spain) their largest age cohorts are now only in their forties rather than their fifties. Within the EU this is especially true of France, but it is even more true of non-EU Mediterranean countries such as Turkey and Tunisia. These countries used to have far higher ratios than the EU or Russia, but no longer do today.
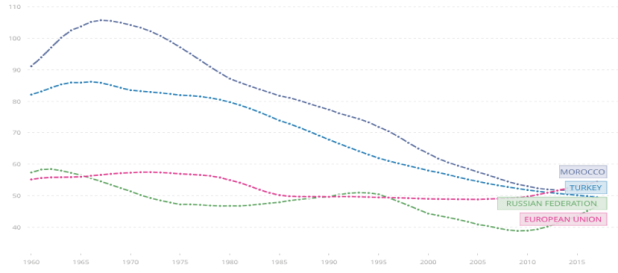
This fall in dependency in places like Turkey and North Africa is part of a greater trend, in which countries in the “global south”, particularly those outside of Sub-Saharan Africa, have recently seen their ratios fall much more quickly than countries in Europe, North America, or Northeast Asia. India’s dependency ratio, for example, fell below both the US’s and Germany’s in 2016. So did Bangladesh’s. (Pakistan’s ratio is falling too, but still remains high, around the level of Japan’s). Latin America’s is even lower; it recently became the lowest of any region, excepting East Asia. The major country that has had the most significant fall in dependency, however, is Iran:

Of course, age dependency ratios are simplistic. They treat all people above the age of 65 and below the age of 15 as if they were the same, and all people between 15 and 65 years old as if they were the same. Yet if (for example) we were to change the upper limit of working age from 65 to 70, Japan’s dependency ratio would fall substantially as a result, because Japan’s largest age cohort today is 65-70 years old. If, on the other hand, we were to change the lowerlimit of working age from 15 to 20, many middle-income countries’ ratios would rise substantially. To address these obvious shortcomings, alternative measures of dependency have been created. Examples of these include the economic dependency ratio, health care cost age dependency ratio, pension cost dependency ratio, and prospective old age dependency ratio. For each of these measures, Canada is forecast to have the biggest increase in the decade ahead among significant OECD countries, while Italy and Britain are expected to have among the smallest increases.
A primary lesson that can be learned from the analysis of age dependency ratios is that the common “young population good, old population bad” view of countries’ economic prospects is a misleading one. In reality countries with young populations tend to remain poor, in part because the youngest countries in the world (in Sub-Saharan Africa) are much younger than the oldest countries in the world are old. It will still be a number of decades before aging populations lead Europe or North America to have a higher age dependency ratio than Sub-Saharan Africa. And even that assumes that no unexpected shifts in migration or fertility will occur.
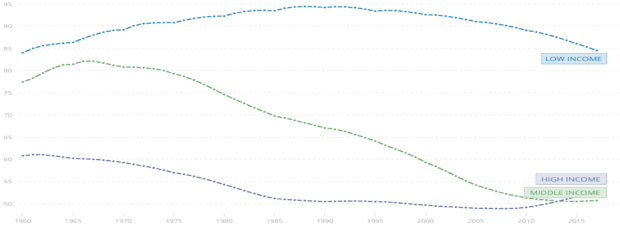
What age dependency ratios do show is two big trends, both of which have to do with middle-income economies. The first trend is the emergence of what we might call a goldilocks belt, located between the aging populations of North America, Europe, and Northeast Asia and the youthful populations of Sub-Saharan Africa. South Asia, North Africa, and Latin America all now appear to be in the process of supplanting high-income countries in terms of having the demographic trends that are arguably most conducive to (or at least, indicative of) economic growth.
The second trend is that Northeast Asia’s dependency ratio, which has been the lowest in the world for a generation and probably played a significant role in helping the region emerge from a low-income to middle-income level, bottomed out almost a decade ago and is continuing to rise.
Taken together, these trends suggest opportunities for middle-income countries, particularly those countries located in or near to the Mediterranean and Caribbean regions, to increase their exports to developed economies, given the aging labour forces of developed economies and traditional exporters in East Asia. In contrast, these trends also suggest that there should perhaps be a greater level of caution regarding the younger, high-growth economies in East Africa, such as Ethiopia or Kenya, which have recently been among the favorites of some emerging market investors.

In democratic countries, political analysts often try to sniff out any regional divisions that exist within a given country by looking at the voting patterns of that country’s electorate. In Italy’s recent election, for instance, it has been thought to be significant that Italians living in northern Italy tended to vote centre/right (including for the Northern League), whereas in southern Italy people tended to vote for the Five Star Movement.
In countries like the People’s Republic of China, however, where no such elections are held, different factors may be looked at instead, in order to gauge the level of regionalism that might exist.
One interesting thing to note here is that almost none of modern China’s top politicians were born in peripherally located areas in the country’s southeast, southwest, northwest, or northeast. The only province in southeast or southwest China to have produced a somewhat notable number of Politburo members is Fujian, a relatively small province where Xi Jinping served 17 years of his career, which is important to China in part because it shares unique social and linguistic connections with the nearby island of Taiwan.


The chart above shows, by birth-province, the number of members in the politburo, politburo standing committee, party secretariat, central military commission, provincial party secretary, or previous politburo standing committee members going back to 1990, adjusted to take into account the varying population sizes of each province. Apart from Fujian and Qinghai (which ranks high on this list only because it has such a tiny population, by China’s standards), all of the provinces at the top of this list are in the north or central coastal regions.
China’s most populous province, Guangdong, has had no leaders on this list. As of 2017, Guangdong may have also broken a thirty year tradition by having its provincial governor not be a native of the province. It is now one of the few provinces not to have a native-born governor.

In this picture above, we see the birthplaces of China’s current top leadership, the members of the Standing Committee. Here we also see the one big exception, Qinghai-born Zhao Leji. Zhao’s career is noteworthy. Zhao served as party chief of Qinghai, breaking the unwritten rule that a person should never be party chief in their birth-province. Zhao was later party chief in Shaanxi, where his parents were from; this too broke an unwritten rule, that a person should not be party chief in their “native” province. Now, Zhao has not only reached the Standing Committee, but has taken over Wang Qishan’s anti-corruption job, a critical position. Some have argued that Zhao has been able to rise in this way mainly because Xi Jinping’s family is also from Shaanxi.

Here’s a map of the birth-provinces of the current 25-member Politburo Central Committee (which includes within it the 7 members of the higher-ranked Standing Committee):

And here, finally, is a map of the birth-provinces of the current provincial party chiefs:

Conventional analysis of Korea seems to be incorrect in its view of the probability of North-South reunification. The conventional view is that reunification grows more unlikely as the disparity in wealth between the North and South (now far greater than that between West and East Germany in the 1980s) continues to increase, and as young South Koreans, who tend to be more opposed to reunifying with the North, come of age.
While we have no way of knowing what the odds of reunification are, we should recognize that the logic behind these conventional views is not sound. Most South Koreans are Baby Boomers or senior citizens, so the issue of young Koreans tending to oppose the idea of reunification may not be nearly as relevant as one might think, even if we do accept the premise that public opinion will help determine the relationship between the two Koreas. An estimated 58 percent of South Koreans in general favour reunification.
As for the enormous economic disparity between the North and the South, it might actually make reconciliation between the two Koreas more probable, not less probable. This is because it makes opportunities available from economic arbitrage higher for both sides.
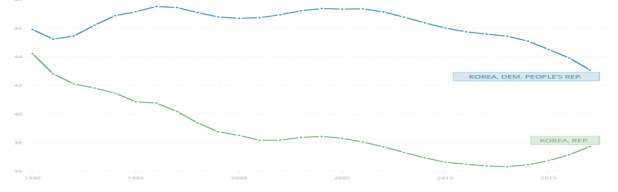
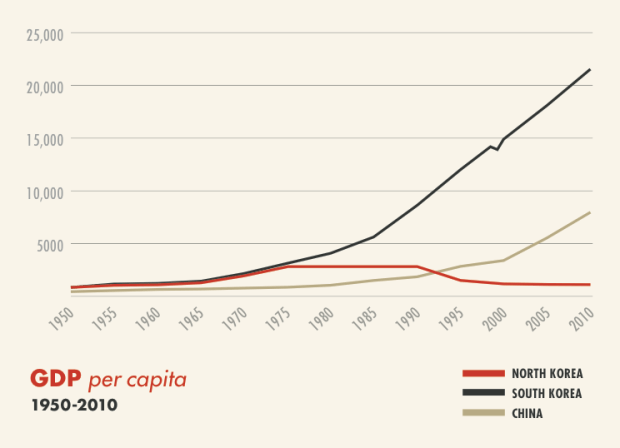
Unlike in previous decades, North Korea and South Korea today have complimentary economic resources and needs. South Korea’s primary resource is capital, which the North needs if it is to finally escape extreme poverty. The South’s primary need is to bolster its increasingly expensive and rapidly aging population (see Figure 1, below), as well as safeguard the imports of fuel and exports of manufactured goods upon which South Korea depends more heavily than does any other major economy (see Figure 2).
 The North’s resources are its cheap labour, coal reserves, and land bridge linking South Korea to China and to Russia.
Working together, either through a reopening of trade and investment channels or through eventual reunification, the South could provide capital while the North provides labour, energy, and direct access to the labour and energy of Northeast China and Pacific Russia. Given the vulnerability of South Korea’s existing trade routes to Europe and the Middle East, which pass the Straits of Hormuz, Malacca, Taiwan, Bab-el Mandeb, and Suez, none of which South Korea has any control over, it is not difficult to see why trading with the North might appeal to the South.

In this context, the current Olympics reconciliation between the two Koreas should not have taken so many people by surprise. (The Olympics reconciliation also should not have been such a surprise because it was preceded by South Korean officials announcing, in March 2017, their intention for South Korea to present a joint bid to co-host the football World Cup in 2030 with North Korea, China, and Japan). This is not to say that theOlympics indicate that a real push towards reconciliation will now occur, let alone a push for reunification. Still, these outcomes should not be ruled out, just as the thaw in the relationship that has taken place at the Olympics should not have been ruled out.
Let us take a brief look, finally, at the current politics/economics of the four outside powers that surround and influence the Koreas: China, Japan, the United States, and Russia.
China and Japan both have leaders who have recently gained in prominence: Xi since the Party Congress this past October, Abe since the Japanese election this past October. China and Japan are both scrambling for access to energy: China to replace coal in order to reduce pollution, Japan to replace nuclear power in order to avoid another Fukushima incident. Both countries are also scrambling for labour: Japan because of its elderly population, China because of wage inflation, the impact of the one-child policy, and the aging of Chinese Baby Boomers. South Korea, which is also increasingly in need of energy and labour, will find it difficult to compete with these two giants. The only place where South Korea may have an edge over China and Japan is its fellow Korean state, North Korea.
This competition among the Northeast Asian economies might increase even more if the United States follows through on President Trump’s pledges to reduce the US trade deficit, get tough on China, and prevent allied nations like South Korea, Japan, and Germany from “free-riding” on the global sea-lanes protection that has been provided by the United States navy. Meanwhile, with the number of US soldiers in Afghanistan having been reduced from around 100,000 in 2011 to only around 11,000 today, the US may now have the ability to threaten the North Koreans more than at any time since September 11, 2001.
Russia, in contrast, is now focused on its engagements in both Syria and Ukraine, which may limit its ability to aid its historic ally North Korea. Russia’s economy is limited too, as a result of the low oil, gas, and coal prices that began in 2015. Russia depends on exporting energy to Europe, but if those exports are imperilled, whether because of worsening relations between Russia and Europe or because of the US’s new transatlantic exports of oil and liquified natural gas, Russia may have to diversify its trade patterns by exporting to East Asia. The Russians are, however, afraid of both China and Japan, and so prefer to trade with the Koreas instead. It is therefore increasingly in Russia’s interest to see reconciliation between the Koreas, so that Russian exports can reach the South via the North and so that the Koreas’ economies and demand for Russian resources can grow.
In closing, we should perhaps begin to consider the Korean situation in the same way that an experienced investor views financial markets: aware of the significance of arbitrage, and aware of the maxim that past results are not a proper indication of future returns. In other words, we should not assume that the North’s isolation and totalitarianism will necessarily continue, and we should not think that the Koreas’ diverging paths means they are less likely to re-converge going forward. Of course we should not be naive about the character of the North’s regime, and we should not be overconfident in assuming it will change. But neither should we discount the possibility of reunification, whether achieved through diplomacy, assassination, or war. Not even in 2018.

The year 2017 has short, medium, and long-term significance in China.
Its short-term significance comes from the Communist Party’s quinquennial leadership transition, which is being held a week from today.
Its medium-term significance comes from being the twentieth anniversary of the most recent notable geopolitical transition in China; namely, of Hong Kong leaving the British to join (in effect) China’s largest province Guangdong, and of Chongqing leaving China’s formerly-largest province Sichuan, in 1997*.
Its long-term significance comes from being the 100th anniversary of the Russian Revolution; of which, with the Soviet Union now long gone, the Chinese Communist Party is the only major remnant. The Party’s centennial is itself arriving in 2021, the first deadline in Xi Jinping’s “Chinese Dream”.
It is interesting to think on how these factors may overlap. The Russian Revolution of course brings to mind the Soviet collapse. That collapse occured 69 years after the Soviet Union’s formation; next year will be 69 years since the People’s Republic of China’s formation. These memories may be reenforcing the desire of China’s leadership to avoid the mistakes they perceive Gorbachev to have made. In a small way, this might be contributing to the Party’s granting more power to Xi Jinping. The promotions Xi makes this week are being watched closely, worldwide, as a yardstick of his clout.
Geopolitics within China
The twentieth anniversary of the political changes to the Hong Kong-Guangdong and Sichuan-Chongqing regions are, arguably, deeply relevant to this issue.
First, the two men Xi is expected to highlight as long-term successors of himself and of Premier Li Keqiang currently lead those regions. Chen Min’er is the party chief of Chongqing, Hu Chunhua is the party chief of Guangdong. Both will have an incentive to keep their regions pliant, in order to realize this rise to the top.
Second, the strongest moves in Xi’s anti-corruption campaign have been taken against top leaders in the Sichuan-Chongqing region: against Sun Zhengcai, party chief of Chongqing, a few months ago, and against Zhou Yongkang, a former chief of Sichuan, in 2015. Sun will be the first Politburo member kicked out under Xi. He will be just the third incumbent Politburo member to fall in the past 20 years, and yet the second party chief of Chongqing (the other being Bo Xilai, in 2012) to do so.
Third, Guangdong and Sichuan are by far the largest of China’s “peripheral” provinces (see graph); provinces outside of the part of China that, roughly speaking, lies between or near Beijing and Shanghai. Few recent Chinese leaders have been born in peripheral provinces; the new Standing Committee that Xi is expected to pick will not have anyone born in a peripheral province. Neither was anyone on the current Standing Committee* born in a peripheral province. Indeed, nobody born in Guangdong or Sichuan holds any of the 43 positions within the Communist Party’s Politburo, Secretariat, or Central Military Commission.

Read the full article here: Geopolitics within China

According to an article in The Economist, the value China’s outbound M&A activity rose sharply in 2016, up approximately fivefold since the summer of 2015 and eightfold above its average rate between 2010- 2015.
The article mentions that this increase could represent a troubling trend for China, of capital fleeing the country in response to its slowing economic growth rate and gradually depreciating currency in recent years.
It then largely dismisses this theory, however, saying, “rather than sparking a stampede [of money] to the exits, it is more accurate to say that these changes [in China’s economic performance] have alerted Chinese firms to the fact that they are still woefully under-invested abroad. China’s share of cross-border M&A has averaged roughly 6% over the past five years, despite the fact that it accounts for nearly 15% of global GDP”.
In other words, the article assumes that, if a country’s share of global M&A does not exceed its share of global GDP, its M&A is less likely to be capital flight. This assumption is not justified, however. It overlooks other key factors that may determine a country’s propensity for engaging in outbound M&A. Such factors include:
1. A country’s physical proximity to other large economies
In order to have cross-border M&A, you need borders to cross. Economies with large neighbours, for example Canada or the Netherlands, tend to have a relatively high propensity for engaging in international M&A.Canada’s cross-border M&A, for example, has tended to be 25-50% as large as the US’s in recent years, in spite of the fact that Canada’s GDP is less than 10% as large as that of the US. China, unlike Canada, does not border any large economies. This impacts not just its M&A, but also trade: in China trade counts for 37% of GDP, whereas in Canada it is 64% and in the Netherlands it is 151%.
2. A country’s cultural and linguistic affinity with other large economies
Most economies in the world speak European languages; Northeast Asia remains something of a linguistic outlier. This may make Northeast Asian countries less likely than other regions to engage in global M&A. Japan, for instance, currently accounts for 6.5 percent of global GDP, yet has accounted for less than 1 percent of global inbound M&A in recent years, and less than 4 percent of cross-border M&A in general. Arguably, China too might be expected to have a low propensity to engage in M&A.
3. Capital availability versus investment opportunity
One of the reasons that Japan’s outbound M&A far exceeded its inbound M&A is that capital in Japan has been cheap (its interest rate is below zero), yet investment opportunities in Japan have been limited (its economic growth rate is 1 percent). Thus, the Japanese borrow money cheaply at home, and often invest it abroad. In China, however, interest rates frequently top 4 percent, while economic growth is estimated to be 6-7 percent. We might, then, expect China to be less M&A-intensive, and generate more of its own investment opportunities domestically rather than seek out ones in foreign markets. Unless, of course, as many economists suspect, China’s true growth rate is much below 6-7 percent.
4. A country’s political relationship with other large economies
Outside of mainland China itself, approximately 45 percent of East Asia’s GDP is generated in Japan, China’s historic regional rival. Outside of mainland China, approximately 29 percent of global GDP is generated in the US, China’s potential global rival. Because China’s relationship with Japan and the US is sometimes a tense one, its investment relationship with Japan and the US may be less than it could otherwise be. For instance, when a territorial spat between China and Japan, over the Senkaku/Diaoyutai islands, heated up (rhetorically) around 2012, cross-border M&A between China and Japan fell sharply. Indeed, in spite of relatively close cultural connections, Japan was not even one of China’s top ten targets of outbound M&A spending in the past decade. China has tended to invest in Europe; Japan in its political ally the US. 43 percent of Japan’s outbound M&A in the past decade went to the US.
5. A country’s relationship to foreign financial hubs
Relatively independent financial hubs, like Hong Kong, Singapore, or Luxembourg, tend to be significant net providers of M&A capital. Their outbound cross-border M&A spending tends to far exceed their inbound M&A, and their global share of cross-border M&A tends to far exceed their global share of GDP. From 2011-2014, for example, Hong Kong’s outbound M&A was about 25-40% as large as mainland China’s, even though Hong Kong’s GDP is only around 2% as large as mainland China’s. (Rightly or wrongly, M&A statistics tend to treat Hong Kong as if it was an independent entity). The fact that the world’s top two financial city-states (Hong Kong and Singapore) are Chinese may suggest that mainland China’s propensity for outbound M&A should be relatively low—just as, for example, US outbound M&A would plummet if (hypothetically) Manhattan were to secede from the US.
The value of China’s outbound M&A as a share of global cross-border M&A should, perhaps, be lower than China’s share of global GDP, then. Yet in 2016 Chinese buyers accounted for an estimated 15 percent of the value of all cross-border M&A, slightly higher than the 14.5 percent of global GDP China had. The Syngenta deal alone, announced in early 2016, was roughly large enough to eclipse all outbound Chinese M&A in any year prior to 2014. China has kept up its M&A pace thus far in 2017, not counting Syngenta.
The explanation that you often hear for why China’s M&A boom is not capital flight — namely, that Chinese firms are seeking foreign expertise and technology, as China transitions to a more knowledge-intensive economy — may have some merit, but still it ignores the fact that money has also been pouring out of China into other assets in the developed world in recent years. To take the most notorious example, Chinese capital been pushing up real estate values in Pacific cities (Vancouver, Seattle, Sydney, etc.) and hub cities (NY, London, Toronto, etc.). The M&A boom, then, may be part of the greater trend of Chinese capital seeking safe haven. China’s 2016 M&A investment in the global safe haven, the US, was roughly triple what it had been in 2015, 2014, or 2013. It was larger than in every year from 1990-2012 combined.
If much of China’s M&A boom really is a result of capital flight, it is also likely to be unsustainable. In part two of this article we will analyze China’s geopolitical structure, to see when (or whether) this boom will end.

It is easy to be small and ignored. But to be large and ignored, it helps to hide within the shadow of an even larger entity. In the realms of economics and geopolitics, there are three very large countries which, though not actually ignored, do not always receive the respect their size demands, as they inhabit the shadows thrown by the world’s colossi, the USA and China. These countries are Canada, Mexico, and Japan.
Japan has by far the third largest economy in the world, by far the second largest developed economy in the world, by far the second largest population among developed economies, and the tenth largest population globally.
Canada is the second largest country in the world, the fourth largest possessor of renewable freshwater, the fourth largest producer of renewable energy, the fourth largest exporter of oil, and the tenth largest economy.
And Mexico has the world’s eleventh largest population, thirteenth largest territory, and fifteenth largest economy. (Only five other nations are top-15 in all three categories: the US and the BRICs). Mexico has 2.5 times the population of the next largest Spanish nation (Colombia), plus a diaspora of 35-45 million in the US. It is also the twelfth largest oil producer in the world. The Greater Mexico Region (including Mexico, Texas, California, Venezuela, and US waters in the Gulf) produces more oil than Saudi Arabia or Russia. This region also has an economy larger than any country in the world, apart from the US or China.
The League of the Overshadowed
At the moment, however, trade between Canada, Mexico, and Japan is quite small. Neither Canada nor Mexico are even among Japan’s top fifteen trade partners. And while Mexico and Canada do trade with one another more often — Mexico recently overtook Britain to become Canada’s third biggest trade partner — trade with Mexico still counts for less than three percent of Canada’s total. Their trade with one another is overshadowed by that of the US. Indeed, California alone trades far more with Canada, Mexico, and Japan than those countries do with one another. There is no League of the Overshadowed… yet.
It may be worth noting, though, that US politics have to a certain extent put trade with Canada, Mexico, and Japan into question. President Trump’s first executive order was to withdraw from the Trans-Pacific Trade Partnership, in which Japan would have accounted for over 60 percent of the twelve member-states’ GDP apart from the US. Trump has also signalled his intention to renegotiate NAFTA, tighten the US-Mexico border, raise tariffs on Canadian farm and forestry products, and keep American fossil fuels cheap.
If these policies are followed through on, they could have the effect of driving US trade partners somewhat closer together. Obviously, Canada and Mexico have an interest in showing that they can trade with one another regardless of what Washington intends to say or do about NAFTA. Both also have an interest in exporting more fossil fuels to Asia, where prices remain more expensive than in the shale-rich US. On June 1, in fact, Canadian senator Paul Massicotte wrote an op-ed calling for Canada and Japan to sign a free trade agreement with one another as quickly as possible, given the failure of TPP and risks for NAFTA. Especially as both Canada and Japan have large majority governments right now, such a deal may happen.
An economic relationship between Canada, Mexico, and Japan could turn out to be far more significant, however, than being just a knee-jerk response to Trump’s America-First politics. As we will see, Canada, Mexico, and Japan are in fact complimentary nations, both economically and geographically. Already they have a propensity to trade with one another that is larger than their absolute trade levels suggest (see graph below). So long as Japan’s economic growth remains stagnant, Mexico remains poor, and Canada remains underpopulated, this propensity does not matter much. But if these conditions do not remain, we should expect trade between these three significant, overshadowed countries to grow by a very large amount.

Complimentary Nations
Economists often talk about land, labour, and capital, considering them fundamental inputs of productivity. In the case of Canada, Mexico, and Japan, these inputs are epitomized: Canada has land but not labour, Mexico labour but not capital, and Japan capital but not land. Together, then, they could make a formidable team.
In Canadian politics and business, it has become common in recent years to say that by exporting natural resources to China, Canada can finally reduce the near-monopoly that the US has on buying Canadian exports. This view, however, is based on a false extrapolation of a trend that is now nearing its end: industrial growth in coastal Chinese cities. As China now seeks to rebalance its economy, by investing instead in its service sectors (which are less resource-intensive) and interior cities (which have a lower propensity to engage in trans-Pacific trade), its demand for Canadian resources is unlikely to continue to surge. Most of the resources it does buy will probably continue to come from within its own borders — China only imports 15 percent of the energy it consumes — or from its “One Belt, One Road” partners in Asia.
In Japan, on the other hand, the reverse is true. Japan has few resources of its own, and no Silk Roads to tap. Japan imports 90-plus percent of the energy it consumes, mainly from the Middle East. Its access to the Middle East, however, is imperilled, both from competition with other Asian countries (notably, China and India) as well as from Middle Eastern conflicts. Consider, for example, that Japan accounts for 30-40 percent of LNG imports globally, yet its primary supplier, Qatar, is now in an open feud with Saudi Arabia. Between competition and conflict, Japan could have to rely more on trans-Pacific trade to get resources. It would not be the first time: in the 1930s, eighty percent of the oil Japan consumed was imported from the US.

Even more important may be the impact of labour-saving machinery — robotics — upon Japanese trade. Because Japan has the oldest population in the world by far, it is planning to become a leader in robotics. Even, for example, as soon as the Tokyo Olympics in 2020, Japan is planning to showcase its robotic prowess. Yet robots are highly energy-intensive, and industrial robots resource-intensive. If Japan really does become the leader in robotics, it is likely to start importing lots of energy and other commodities from resource-rich countries like Canada. It may also be likely to start exporting its robotic technologies to countries like Canada, given Canada’s abundance of resources but lack of a large, cheap, human labour force.
Upstairs, Downstairs
Today, if you exclude the US or Europe, Canada and Mexico have the largest combined economies of any pair of countries which are part of the same trade bloc (see graph 1 below). Yet if you include Europe, Canada and Mexico still rank quite a bit lower than a number of pairings of Europe’s largest economies (graph 2).
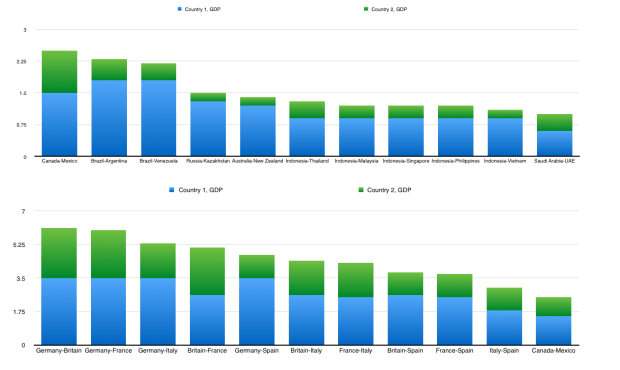
In other ways, however, Canada and Mexico rank ahead of these European pairings. In population they do so (graph 3). In land they do so too (indeed, Mexico alone is larger than any four countries in the EU combined). And in terms of their indirect, second-degree trade (their combined trade with a third country), Canada and Mexico as a pair lead the world (graph 4), a result of their both trading hugely with the US.

While Canada’s propensity to trade with Mexico is greater than with any significant country apart from the US, it is still only around half as high as its propensity to trade with the US. The reason for this is simple: Canada and Mexico do not share a border with one another. They are not even very close in proximity to one another. More than 3000 kilometres separate Mexico City from any of the largest cities in Canada.
This separation is also reflected in Canada’s lack of a significant Spanish-speaking diaspora, particularly relative to that of the US. In spite of the fact that 21 percent of Canada’s population is foreign-born, compared to just 14 percent in the US, only 0.3 percent of Canada’s population is Mexican, compared to an estimated 11 percent of the population in the US. Even the state with the smallest share of its population being Mexican or Mexican-American—Maine—has a higher share, 0.4 percent, than Canada does.
But this may be likely to change, for two reasons. First, there is a political faction in the US which is wary of further Hispanic immigration, seeing it as a threat to the singular position held by the English language in America. Second, whereas the population of the US is relatively young, the population of Canada is Boomer-dominated, inching towards old age. This is especially true of the population of Canada’s French-speaking provinces, Quebec and (partially) New Brunswick. These provinces also, because of the far smaller language gap between French and Spanish than between Spanish and English, have a much higher propensity to attract Latin Americans than do other parts of Canada (see graph). Between demographics of this kind and US immigration politics, the next major wave of Latin American emigrants could be to Canada.

The aging population of Canada’s Baby Boomers, and especially of Quebec’s Baby Boomers, also indicates another area in which Canada-Mexico economic ties—both direct and indirect—are likely to grow: tourism. Already today, Mexico is the largest destination for Canadian travellers apart from the US, while the areas of the US that Canadians spend the most time in — Florida, the Southwest, and New York — are ones in which Mexican-Americans (or in Florida’s case, Hispanic-Americans in general) inhabit in large numbers. As Canadian Baby Boomers reach old age or retire, they are likely to spend more time in places like Mexico, in order to avoid much of the discomfort (even danger) of dark, icy Canadian winters. This will be most true of Quebec, given its older population, colder winters, and greater ability to learn Spanish.
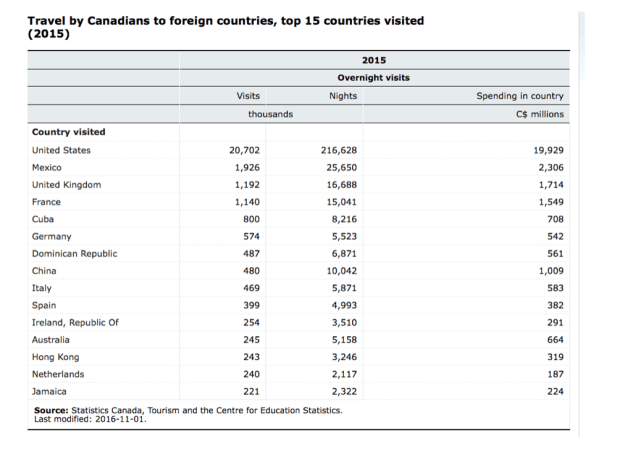
As the chart above implies, the US reconciliation with Cuba may also lead Canadians to spend more time in Mexico. During the past generation, the US rivalry with Cuba has given Canadians a near lock on the Cuban market. Canadians account for an estimated forty percent of all visitors to Cuba, and Cuba accounts for a disproportionately large destination (given Cuba’s relatively small size) for Canadian tourists. As the US allows its own population to go to Cuba, however, Canadian snowbirds will lose the advantage of having such a cheap, warm country all to itself. Many will re-route to other Latin American beaches.
An even more important pull factor for Canadian snowbirds will be “e-commuting”. The ability for young Canadians to spend time in a cheap, warm country in the winter is likely to increase dramatically as a result of the modern Internet. This is also likely to impact the Baby Boomers. If, for example, it becomes easier for a Boomer’s children and grandchildren to come visit them in Florida or Mexico for, say, a whole month over Christmas, rather than for just a week, then Boomers will be likelier to go in the first place.
And the relationship may not even remain one-way only: Mexicans may begin to visit Canada more often too. Today Mexicans do not go to Canada much, because they lack the disposable income to do so. If and as Mexicans become wealthier, however, they may look to Canada as a place to go in the summer; a place where the summer weather is not too hot, the major metropolises are not too crowded, and a cottage by a northern lake may be rented at an affordable rate. Climate change could, sadly, also play a role in this equation. Mexico — and the Southwestern US, in which tens of millions of Mexican-Americans live — is dangerously arid, whereas Canada is in possession of an abundance of renewable, surface-level freshwater.
Conclusion—The New Drivers of Trade
Today, the main driver of trade is proximity. Countries which share borders with one another tend to trade a lot — though, of course, there are many exceptions to this — whereas far-away countries tend not to. However as (or, admittedly, if) globalization continues, proximity may no longer matter as much. Complimentarity may matter a lot more. We have seen here various ways in which Canada, Mexico, and Japan may be complimentary to one another. Canada has land but not labour, Mexico labour but not capital, Japan capital but not land. Canada has cold, dark winters but warm, water-rich summers, Mexico warm bright winters but hot, arid summers. All three countries have coasts on the North Pacific Ocean; none are part of the Asian (or Eurasian, or Afro-Eurasian) continent. And all three countries are very large, yet are overshadowed by neighbours that are far larger than they are. They may end up, if only informally, a formidable League.
The Korean War, fought from 1950-1953, was a result of two earlier wars in the 1940s: the US-Japanese War, which ended with the destruction and occupation of Japan in 1945, and the Chinese Civil War, which ended in a Communist victory (and Nationalist retreat to Taiwan) in 1950. With the Communists and Americans as the only powers in East Asia following these wars, the Korean peninsula was split in two, each side taking a piece for itself.
When the US triumphed over the Soviet Union around 1990, many expected the North Koreans to fix their broken ties with South Korea. That this did not occur was partly the result of inertia, partly the result of Kim Il Sung’s living until 1994, and partly the result of the 1997 East Asian financial crisis, which kept the South Koreans too poor to want to incur the cost of investing in North Korean infrastructure or labour.
It was also partly the result of a miscalculation on behalf of North Korea in 1987, twenty-four months before the Berlin Wall came down. Seeking to ruin the South’s first-ever Olympics in 1988, the North blew up a commercial airplane. It was by far the deadliest attack on the South since the armistice began in 1953. South Korea’s anger and mistrust of North Korea as a result of this deed persisted during the ’90s.
When the 21st century arrived the situation changed again. The US, after having fought the bulk of its four major 20th century wars in East Asia—in the Philippines, WW2, Korea, and Vietnam—shifted its focus elsewhere in 2001. This shift was mainly a result of US wars in Afghanistan, Iraq, and Libya. To a lesser extent, it has also been a result of recent Russian interventions in Georgia, Ukraine, and Syria .
In East Asia, meanwhile, China’s GDP surged, while Japan’s continued to stagnate like it had in the ‘90s. Between Chinese growth, Japanese stagnation, and US distraction, East Asia became again a two-power region: the United States and China now dominate the region. But this may now be ending. In the years ahead, East Asia is likelier to become either a one-power region, like it was in 1990s, or a three-power region (the US, China, and Japan). The two-power status quo could remain in place, but is hardly certain to do so.
In a one-power or three-power region, the powers involved may have less to gain from the continuation of poor relations between North and South Korea. There will be much less reason to split Korea in two, as it has been for 67 years now, when East Asia as a whole is not split between two major powers, as it is today.
The move towards a one-power East Asia, or towards a three-power East Asia, is plausible for three reasons:
First, the US has been drawing down from the Middle East. It had 150,000 soldiers fighting in Iraq and Afganistan in 2011, but now has fewer than 15,000. Unless it decides to wholly reverse this process — Trump has announced the addition of 4,000 soldiers to Afghanistan, but that is a far cry from the Obama-era surge—the US will have the ability to focus on other regions, like East Asia, more than it could during the 2000’s.
Second, China’s GDP growth has slowed, from 10-15 percent growth during the 2000s to 3-7 percent (depending on whether you believe its official growth rate, 6.7%) last year. In order to keep up with 2.5 percent US growth, China must grow around 4 percent. China’s challenge in doing this is that its labour is now much costlier and older than it used to be, while its resource wealth, most notably its coal, has led to pollution.
China may struggle to keep up with US power. As it is, the US economy is an estimated 1.6 times larger than China’s. [The US-Canada-Britain-Australia alliance, meanwhile – which, unlike China itself, more or less speaks a single language – has a GDP 2.2 times larger than China’s]. The US GDP alone is larger than that of East Asia as a whole.
Third, the economy of Japan, which today is an estimated 37 percent as large as China’s and 18 percent larger than Germany’s, is likely to benefit from the crash in oil and other natural resource prices that began in mid-2015. Unlike China, Japan has few resources of its own, and so depends on imports to fuel its economy.
While Japan’s aging population continues to be a challenge — Japan’s largest age cohorts are 40-45 year olds and 65-70 year olds — it may be able to address the challenge via automation, immigration, and a labour force dominated by technically skilled 50-80 year olds. Japan is already planning to advance its robotic prowess in the near term, as it wants to showcase them at the 2020 Tokyo Olympics.
Japan’s robot drive is likely to have consequences not just for the Japanese economy, but also for the Japanese military. Japan has already begun to rebuild its military of late, first in response to China’s rise and then in response to Donald Trump’s rhetoric that US allies should “stop freeloading, and pull their own weight”. Already today the Japan ranks 8th in military spending, despite devoting just one percent of its GDP to it. Should Japan double this, to reach the 2 percent of GDP that France and Britain spend, it would then become the third largest military spender in the world, and move far ahead of the next largest, Russia. (Were Japan to spend 5 percent of GDP on its military like Russia does, it would move far ahead of China).
Even if Japan does not re-emerge, East Asia might not remain a two-power region. Rather, China could fall behind the US sufficiently that, in effect, it will be a one-power region again, like it was in the 1990s. US power is rising not only due to its withdrawal from the Middle East, but also because its rivals, most notably Russia, are being hurt by the fall in resource prices. As in the ’90s — when oil prices were at all-time lows — cheap oil works in the US’s favour. And if US power in the region does rise, the North Koreans might be less willing to resist its demands.
There is an additional reason for improving relations between the North and South: it may benefit the South’s economy. Unlike in the 1990s, South Korea is now a relatively wealthy country. Yet because of its rapid growth, it has become dependent on imports of natural resources and exports of manufactured goods. South Korea has been importing resources mainly from the Middle East, and exporting mainly to China.
The Middle East, however, remains unstable. Qatar, for example, the world’s largest LNG exporter, sells more to South Korea than to any other country. But Qatar is now in open conflict with Saudi Arabia. Uncertainty of this kind threatens South Korea’s GDP growth. In addition, as China tries to shift from coal to gas, and as Japan tries to shift from human labour to fuel-powered robots, South Korea may have to deal with rising competition from its own enormous neighbours when importing fossil fuels from the Middle East.
Similarly, South Korean exports have been limited by the slowing Chinese economy. China accounts for a quarter of all South Korean exports, more than the US and Japan combined. South Korea has also been hurt by its own success: its labour is no longer so cheap like it was in previous decades, when it was still a poor country. For these reason, South Korea has already grown more slowly in the past two years that at any time since 1997 (excepting the global financial crisis in 2009).
These economic troubles are occuring at a bad time for the South. South Korea will host the the first-ever Winter Olympics in continental Asia this year. It wants the world’s perceptions of itself—namely, that it is a remarkable country, with remarkable companies like Samsung and remarkable economic prospects in general—to endure. It also does not want the North to cause trouble this time, as occured in 1987.
Trading with North Korea could help address both these concerns. North Korea has an extremely cheap, Korean-speaking labour force; a labour force that includes cousins, and in some cases even siblings, of the South’s. It represents a potential Korean-speaking market for South Korean exports, both of media and manufactured goods. It even, if ties improve enough, offers opportunities in tourism. And it offers access to natural resources. The North Koreans are rich in coal; the South Koreans are top coal importers. More importantly, the North offers a land route by which South Korea can access resource-rich Manchuria and Siberia.

It is possible, of course, that the Korean issue will be addressed by war rather than by trade. In the past year alone, the US has prepared for such a war. It is also possible that the North will not be addressed at all; that the tyrannical staus quo will endure. But for the reasons outlined above, I believe reconciliation is the most likely, and the status quo the least likely.
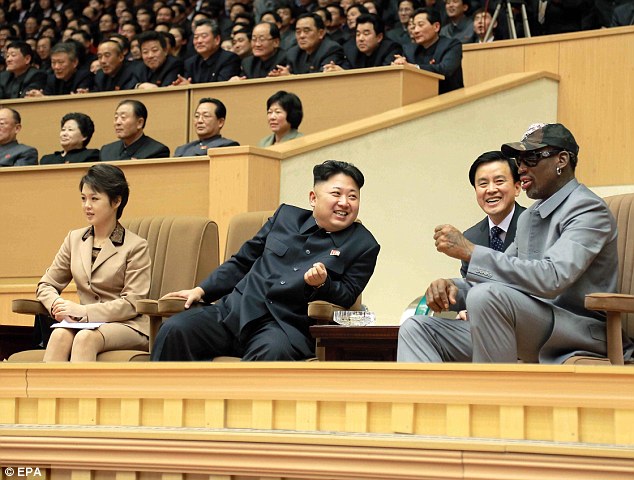
Dennis Rodman, who played on the the 1990s Chicago Bulls (Kim Jong Un’s favorite basketball team) has lately met with Un. Do not be suprised if Rodman’s Celebrity Apprentice co-star, Donald Trump, follows suit.
There is a recent pattern in American politics, in which Democratic politicians who succeeded in presidential elections were not born in northern states (e.g. Obama, Clinton, Carter, Johnson, Truman, and, if you must, Al Gore), while Republicans who won presidential elections — so, not counting Ford, who inherited Nixon’s presidency post-impeachment — have had very close ties to either Texas (the Bush’s, Eisenhower), California (Reagan, Nixon), or Florida (Bush, Trump).
To some degree, this pattern presumably reflects the old divide between the country’s Northeast and Southeast. The Democrats, who have their base of support in the Northeast, have had trouble in elections when they do not reach out to the South by selecting one of its native sons as their candidate. The Republicans, who have support in the Southeast, have had trouble winning when they do not secure the support of at least one of the country’s three largest states—California, Texas, or Florida.
Looking at the home regions of China’s leading politicans, it is fairly easy to discern a similar north-south divide. A large share of Chinese leaders were born in northern China. These include Beijing-born Xi Jinping (who’s father, Xi Zhongxun, was from Shaanxi) and Shandong-born Wang Qishan (a former mayor of Beijing, now Xi’s anti-corruption chief). At present, out of China’s seven Standing Comittee top leaders, only seventh-ranked Zhang Gaoli was born in southern China. Five of the seven were born in the north and one, Premier Li Keqiang, was born in in central China. Many politicians of the past, such as Zhao Zhiyang or Hua Gaofeng, have also hailed from the north.
Indeed, as far as I can tell, Zhang Gaoli may in fact be the first person in thirty years to be born outside of northern or central China and have made it to the Standing Committee. He is also the only person currently serving in the Party’s 25-member Politburo born outside north or central China.
Central China — which, somewhat confusingly, is sometimes considered to be part of Southern China, though it is located far north of the ‘deep south’ regions like Guangdong or Yunnan — has also produced its fair share of notable figures, such as Hu Jintao, Jiang Zemin, Li Keqiang, Zhou Yongkang, and Wu Bangguo, all of whom were born in Jiangsu or Anhui. There seems, in fact, to be a very recent trend in which, when the General Secretary is from northern China, then the Premier is from central China, and vice versa. So, for example, there is now the pairing of Xi and Li (born in Beijing and Anhui, respectively), and before them the pair Hu and Wen (Jiangsu and Tianjin).
Some may interpret this as an implicit power-sharing arrangement between central China and northern China. While at present most leaders come from northern China, this was not the case a generation ago. Jiang Zemin (born in southern Jiangsu), Zhu Rongji (northern Hunan), Li Peng (Shanghai), Hu Yaobang (northern Hunan), Li Xiannian (Hubei), and Yang Shangkun (Chongqing) were not from the north. Of the “Eight Elders” of the 1990s and 1980s, six were born in central or south-central China; the other two in Shanxi. Even Xi Jinping, a northerner, spent his political career in central China or south-central China, in Hebei, Fujian, Zhejiang, and Shanghai.
The pattern, if it does actually exist, does not appear to be unique to civilian political leaders. Among today’s 11-man Central Military Commission, seven were born within northern China, while two were born in north-central China and two in south-central China. None are from the deep south.
Meanwhile, out of the 205 active members of the Party Central Committee, fewer than 15 were born in the deep south*. (*Here, please correct me if I am wrong. I do not speak Mandarin, and finding this information was difficult. Bo Zhiyue’s work was useful and worth reading, but has a different emphasis). No person born in the vast southeast province Guangdong, or the vast south/centre- west province Sichuan, holds one of the 43 positions in either the Communist Party’s Politburo, Secretariat, or Central Military Commission, at or around the highest levels of China’s political hierarchy.
The Sichuan basin has also witnessed a spate of high-profile political take-downs in recent years, notably of Chongqing’ party leader Bo Xilai and, later, of Sichuan province’s former chief Zhou Yongkang. Now Chongqing’s party chief is Sun Zhengcai, who is the youngest member of the current 18th Politburo and formerly served as party chief of Jilin. Guangdong’s party chief, Hu Chunhua, is the second youngest member of the Politburo and formerly served as party chief of Inner Mongolia, after having spent most of his career working in Tibet.
This may be significant, in both cases. Southern China, as well as other areas that might perhaps also be considered to be ‘peripheral’ (including Inner Mongolia, Tibet, and even Jilin), appear often to have been used as something of a stepping-stone to power by young, up-and-coming leaders like Hu and Sun. The idea is—presumably—that they will do whatever it takes to secure the Party’s interests in those regions, given they have such bright future careers to lose if they fail to do so. Past instances may include Hu Jintao serving in Guizhou and Tibet, Zhao Zhiyang in Guangdong, or maybe even Xi in Fujian. In the case of Hu and Sun in Guangdong and the Sichuan basin, they might be there simply because of those regions’ large sizes and significance—but perhaps they are also there to preempt dissent.
…And yet. Much of China’s economic output is generated in areas from around Shanghai south to Guangdong; particularly if you include Taiwan as being part of the country. Guangdong alone accounts for an estimated 10% of mainland China’s GDP and more than 25% of its exports. This creates, perhaps, an unbalanced dynamic: China’s political periphery is also its top commercial engine.
Americans might be tempted to call this state of affairs “taxation without representation”. While I will not stoop to doing so, I would however be very interested in hearing feedback about these patterns from any of the billion or so people who are more knowledgable on Chinese affairs than I am.

Today, at $45-50 a barrel, the price of crude oil has risen significantly from the $30 lows it reached around the start of 2016. Still, it remains quite far below the $80-110 range in which it resided during most of the past decade, prior to its crash in mid-2014. Gas and coal prices, meanwhile, have in most areas of the world fallen even more than those of oil has. China, because it is the world’s largest net importer of oil and of fossil fuels in general, has often been viewed as a country that is likely to benefit from these cheaper prices.

This view may be incorrect. Not only do China’s energy imports not equal a large share of its GDP, but the growth of China’s energy imports going forward may be slower than many predict. Moreover, there is an enormous discrepancy in the amount of fossil fuels produced by various regions and provinces within China. As such, the crash in energy prices may excacerbate, or at least influence, some of China’s preexisting geo-political divisions.
Energy Imports
China may be the world’s largest energy importer, but it is has also become its second largest energy producer, and as such only relies on energy imports for an estimated 15% of its total energy consumption, in contrast to 94% in Japan, 83% in South Korea, 33% in India, 40% in Thailand, and 43% in the Philippines. In 2014 imports of oil were equal in value to just around 2.4 % of China’s GDP, according to the Wall Street Journal, compared to 3.6% in Japan, 6.9% in Korea, 5.3% in India, 5.4% in Thailand, 4% in the Philippines, and 3.3% in Indonesia.
South Korea and Japan also imported more than two and four times more liquified natural gas, respectively – the prices of which tend to track oil prices more closely than conventional natural gas prices do – than China did. China’s LNG imports barely even surpassed India’s or Taiwan’s. China’s imports of natural gas in general, meanwhile, were less than half as large as Japan’s and only around 20% percent greater than South Korea’s.

China, furthermore, tends to import energy from the most commercially uncompetitive, politically fragile, or American-hated oil-exporting states, such as Iran, Russia, Iraq, Angola, and other African states like Congo and South Sudan. In contrast, Japan and South Korea get their crude from places that will, perhaps, be better at weathering today’s low prices, namely from Kuwait, Qatar, the UAE, and Saudi Arabia. (Granted, China gets an enormous amount of oil from Saudi Arabia too; however, Saudi oil does not count for nearly as large as share of China’s oil imports as it does for Japanese or South Korean oil imports). Similarly, China gets much of its natural gas from Turkmenistan, Uzbekistan, and Myanmar, whereas Japan imports gas from Australia and Qatar and South Korea imports gas from Qatar and Indonesia. China’s top source for imports of high-grade anthracite coal, and its third largest source for coal in general, is North Korea.
China has, in addition, invested capital all over the world in areas hurt by falling energy and other commodity prices, both in developed countries like Australia and developing economic regions like Africa. With energy prices cheap, it may get low returns on these expenditures.
Energy, History, and Politics
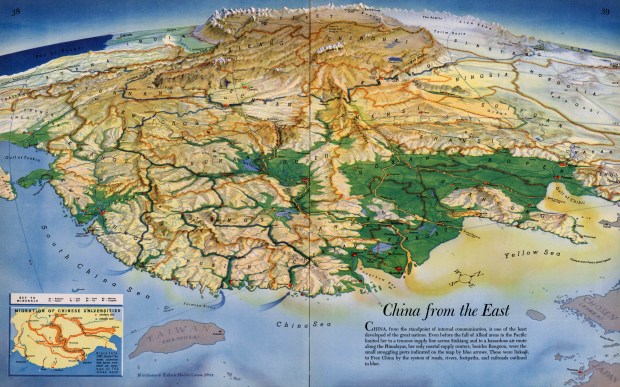
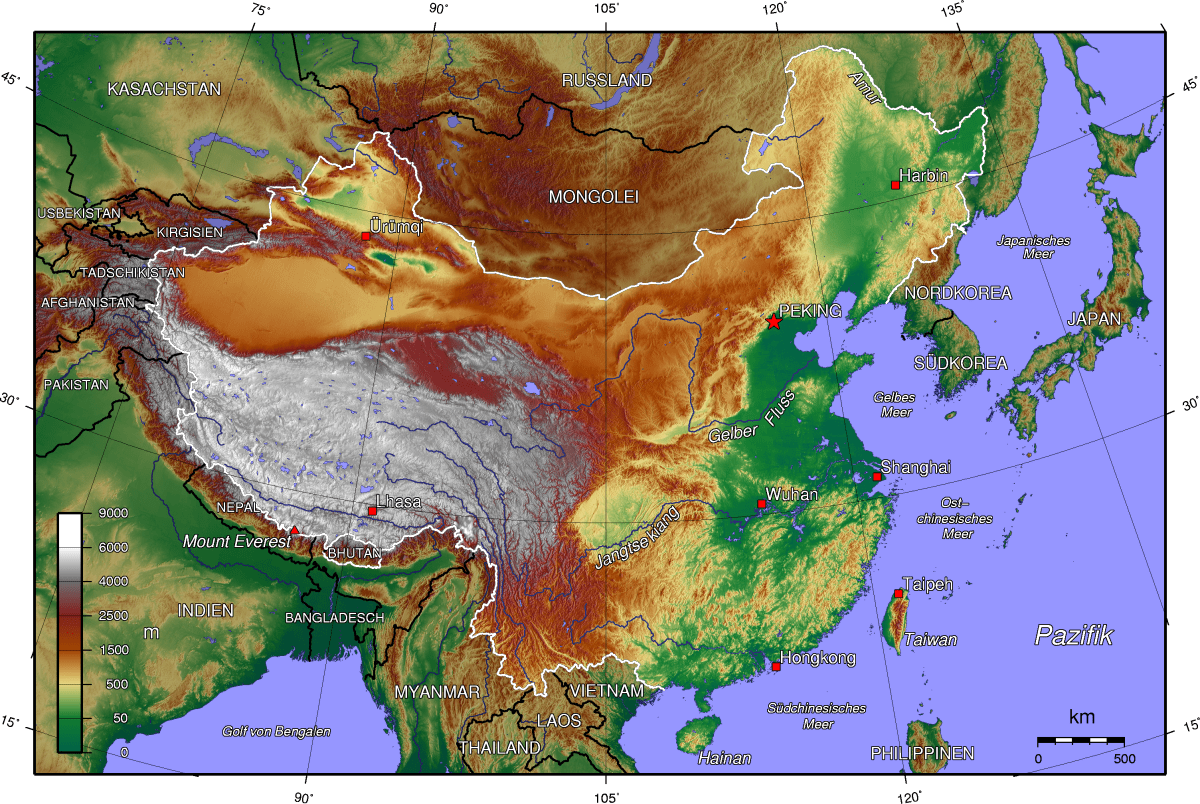
Another mistake the financial media makes is looking at China as if it were a country, rather than what it really is: both a country and a continent. Continents contain deeply-rooted divisions along regional, linguistic, and ethnic lines. China is no exception. China’s main division, roughly speaking, is between areas south of the Yangtze River, which tend to be mountainous, sub-tropical, and dependent upon importing fossil fuels, and areas north of the Yangtze, which tend to be flat, more temperate, and rich in fossil fuels.

China’s Physical Topography China’s Population Density

Northern China, stretching over 1000 km from Beijing southward to Shanghai on the Yangtze, is the country’s political heartland. It is densely populated and home to most of China’s natively Mandarin-speaking, ethnically Han citizens. When compared to southern China, the north has historically been somewhat insulated from foreigners like the Europeans, Americans, and even Japanese. Beijing’s nearest port is roughly 5000 km away from Singapore and the Strait of Malacca; Hong Kong, in contrast, is only around 2500 km from Singapore and Malacca. Beijing is rougly 2600 km from Tokyo by ship, whereas Shanghai is 1900 km from Tokyo and Taipei (in Taiwan) is 2100 km from Tokyo.
Japan’s Ryukyu island chain and the Kuroshio ocean currents historically allowed for direct transport from Japan to Taiwan and the rest of China’s southeastern coast; the Japanese controlled Taiwan for more than three and a half decades before they first ventured into other areas of China in a serious way during the 1930s. Even today, Japan accounts for a larger share of goods exports to Taiwan than do either China or the US.
Southern China has often depended on foreign trade, since much of its population lives in areas that are sandwiched narrowly between Pacific harbours on one side and coastal subtropical mountain ranges on the other. In northern and central China, in contrast, most people live in interior areas rather than directly alongside the Pacific coast.
People in the northern interior often did not engage in as much foreign trade as those on the coast, as, in the past, transportation in the interior was often limited by the fact that northern China’s chief river, the Huang-he, is generally unnavigable and prone to flooding northern China’s flat river plains, destroying or damaging roads and bridges in the process. In southern or central China, by comparison, even people living far inland could engage with the coast by way of the commercially navigable Yangtze and Pearl Rivers, which meet the Pacific where cities like Shanghai, Guangzhou, and Hong Kong are located.
Northern China, however, was most directly exposed to the land-based Mongol and Manchu invaders who ruled over the Chinese for most of the past half-millenium or so, prior to the overthrow of the Manchu-led Qing Emperor in 1912. Today, of course, the north continues to retain China’s political capital, Beijing, and a disproportionally large majority of Chinese leaders were born in northern China — including Beijing-born Xi Jinping and Shandong-born Wang Qishan, a former mayor of Beijing). This is in spite of the fact that most of China’s leading political revolutionaries in the twentieth century, including Mao Zedong, Deng Xiaoping, Sun Yat Sen, Chang Kai-Shek, Zhu De, Ye Jianying, Hong Xiuquan, and the writer Lu Xun, hailed from southern or south-central China.
At present, out of China’s seven Standing Comittee top leaders, only seventh-ranked Zhang Gaoli was born in southern China; whereas five of the seven were born in northern China and one, Premier Li Keqiang, was born in central China. Zhang Gaoli may in fact be the first person born outside of northern or central China in thirty years to have made it to the Standing Committee. He is also the only person currently in the 25-member Politburo born outside of northern or central China. Meanwhile, among the 11-man Central Military Commission, seven were born in northern China, while two were born in north-central China and two in south-central China. By my count, out of the 205 active members of the Party Central Committee, fewer than 15 seem to have been born south of central China.
Indeed, the southern half of China, stretching from islands in Taiwan, Hainan, Hong Kong, Xiamen, and Macau in the east to the plateaus of Yunnan, Sichuan, and Tibet in the west, seems to be politically peripheral. It is home to a majority of China’s 120 million or so non-Han citizens (most of whom are not Tibetan or Uyghur, though those two groups recieve almost all of the West’s attention), as well as home to China’s 200-400 million speakers of languages other than Mandarin, and to China’s tens of millions of speakers of dialects of Mandarin that are relatively dissimilar to the Beijing-based standardized version of Mandarin, and to most of China’s 50-100 million recent adopters of Christianity, and, finally, to most of China’s millions of family members of the enormous worldwide Chinese diaspora.
Southern China is closer to Southeast Asia, a region with an enormous, economically active Chinese population (many of whom speak southern Chinese languages like Cantonese), than is northern China. Southern China’s Fujian province, in particular, is both linguistically and economically close to Taiwan, and southern China’s Guangdong province—the largest province in China—to Hong Kong. A large share of China’s GDP comes from the coastal areas of China from around Shanghai south to Guangdong, particularly if you include Taiwan as part of the country. Guangdong alone accounts for an estimated 10% of mainland China’s GDP and over 25% of its exports. This creates, arguably, an unbalanced dynamic: China’s political periphery is also its main economic engine.
Fossil Fuels
As it happens, northern China produces almost all of China’s fossil fuels. Most Chinese energy is, in fact, produced in and around the province of Shanxi, 300 km or so west of Beijing, where a tremendous share of China’s (and, indeed, the world’s) coal is mined. Shanxi has also seen the biggest political shakeup of any province from Xi Jinping’s anti-corruption campaign thus far. When combined with the northern “Autonomous Regions” of Inner Mongolia and Xinjiang, as well as China’s north-easternmost province Heilongjiang, Shanxi produces a gigantic of China’s fossil fuels in general. Other northern areas, such as Shandong, Liaoning, and Tianjin, are also significant oil producers.
Southern and central China, in contrast, account for most of China’s imports of fossil fuels—especially if you include the economy of Taiwan as being part of southern China. Taiwan, in fact, may be more dependent on oil imports than any other significant economy in the world, according to data from the Wall Street Journal. Falling energy prices may weaken the historical political heartland of China relative to its periphery, in that case. Whether or not this will generate political instability going forward remains to be seen.
Looking Ahead
If (a big if) energy prices remain low for a sustained period, then the question of China’s future dependence on imported energy also becomes relevant, as does the question of the future dependence on imported energy of China’s most important neighbours. In that case, how dependent on energy imports will countries like China, Japan, and India be in a decade or two from now?
While it is impossible to know what the future will be like, it is not difficult to imagine that China will remain less dependent on energy imports than India and/or Japan during the years or decades ahead, as a result of India’s still-emerging economy and Japan’s still-roboticizing economy.
China is not likely to be a major adopter of energy-intensive robots, in per capita terms, because China has a far larger cheap labour force than any country in the world apart from India. Japan, in contrast, will likely help lead the robot revolution, as its labour force is expensive and aging rapidly. This could make Japan even more dependent on importing energy, as machines that are both highly mobile and capable of sophisticated computation require an enormous amount of energy to run — and indeed, one of their main advantages over human labour is that they can and frequently will be tasked to run 24-7, without even taking any time off for holidays or sick days.
China is not certain to increase its energy imports nearly as much as less-developed economies like India, meanwhile, as the Chinese inudstrial sector is facing challenges as a result of its past generation of energy-intensive growth. China faces rising labour costs in many of its cities; a pollution problem; a US that is concerned with Chinese industrial power; and countries throughout the world afraid of China’s world-leading carbon emissions.
In addition, China is located much further away from the Persian Gulf and Caspian Sea oil and gas fields than the Indians and other South Asians are, and so might have difficulty accessing them in a pinch.
China may also, for the first time, have to face industrial competition from resource-rich economies such as Australia, Norway, Canada, Texas, or even the Gulf Arab states,which may be able to use energy-intensive robots of various kinds to build up their manufacturing sectors in spite of their small, expensive domestic labour forces.
All this could make China’s industrial growth rate slip, which in turn might reduce China’s resource imports and thus prevent China from becoming the leading beneficiary of low energy and commodity prices.
Such a shift will be especially likely if the United States or European economies decide to enact tariffs on goods coming from places that generate power by using coal in inefficient ways, a prospect that has become increasingly likely as a result of America’s triple-alliance between environmentalists opposed to coal consumption, shale gas producers competing with coal miners, and energy companies trying to pioneer more expensive but cleaner ways of consuming coal and other fossil fuels. China may then have to focus on growing its service sectors instead of its energy-intensive industrial sectors.
China, Japan, and Siberia
Japan, lastly, might benefit from Russia’s energy-related woes more than China will. This is not only because the Chinese have to a certain extent often looked to Russia as an ally against the West, but also because the areas of Russia that China is close to are mostly irrelevant to China: they are landlocked, Siberian, and for the most part located far from China’s population centres.
Pacific Russia, in contrast, which is located next to the Sea of Japan on the East Asian side of Russia’s Pacific mountain ranges, has a far more liveable climate than does most of the continental Siberian interior. It is home to several small or medium-sized port cities, such as Vladivostok and Petrapavlovsk-Kamchatsky, which are very, very far away from Moscow. This region accounts for much of the oil and nearly all of the Russian gas exports to Asia—especially energy-rich Sakhalin Island, which is just 40 km away from Japan and was half-owned and inhabited by the Japanese prior to the Second World War.

Russia may, in fact, be somewhat better prepared to fight another border war with China like it did in 1969—which might not be too different than the many other wars Russia has fought within or near its borders both prior to or since then—than it would be to face off against Japan again within the far-eastern, mountainous, archipelagic and peninsular Pacific Russian region, as it did in 1905 and then again during the 1930s and WW2. Of course this does not mean Japan will attack Russia — though it has certainly toyed with the idea of eventually making some bolder moves in the Southern Kuril Islands, which both countries claim as their own. Even the remote, unstated possibility of conflict, however, may help grant Japan leverage in any negotiations with Russia regarding commercial or political issues.
Conclusion
All of this is not to be bearish on China’s future. Energy-intensive industrial growth, after all, woud not necessarily mean an improved quality of life for Chinese citizens. Ideally Chinese standards of living will rise at a considerably faster pace than its energy usage. It does seem, though, that China’s economy may not turn out to be a major beneficiary of the fall in energy prices. The PRC’s neighbours on the other hand, such as Japan and Taiwan, which are less rich in fossil fuels or in labour, may benefit greatly. So too might the poorer countries that depend on energy imports, like India and the Philippines. Just as important, however, yet often overlooked, are China’s domestic geopolitics. Internal Chinese divisions—including along north-south and east-west lines—have been, and might remain, of paramount importance. Energy prices could impact them too.
