Internal Chinese Geopolitics, part 1

How can one measure China’s stability? In the West, it is common to look to Hong Kong and Tibet as litmus tests of the strength of the central Chinese government. While it is true that Hong Kong and Tibet are important places — Hong Kong because it one of China’s major financial and service centres, Tibet because it encompasses around 15 percent of China’s territory and contains the headwaters of China’s, India’s, and Southeast Asia’s most important rivers — the inhabitants of Hong Kong and Tibet do not even account for 1 percent of China’s overall population.

To get a better sense of China’s political stability, then, one must also examine the other areas of China where the dictates of the central government in Beijing are most likely to be resisted. Arguably, these include the following seven areas: the Sichuan basin, Southwestern China, Southeastern China, Northeastern China (formerly known as Manchuria), the Shanghai Municipality, and the “Autonomous Regions” of Xinjiang and Inner Mongolia.

With the exception of Shanghai, not a single person born in any of these areas has become the ruling General Secretary of the Communist Party of China or the Premier of the People’s Republic of China. And yet, taken together, these areas have a population of almost 600 million people – close to half of China’s total population. So, let’s take a brief look at each one of them:

The Sichuan Basin –  Population: 111 million

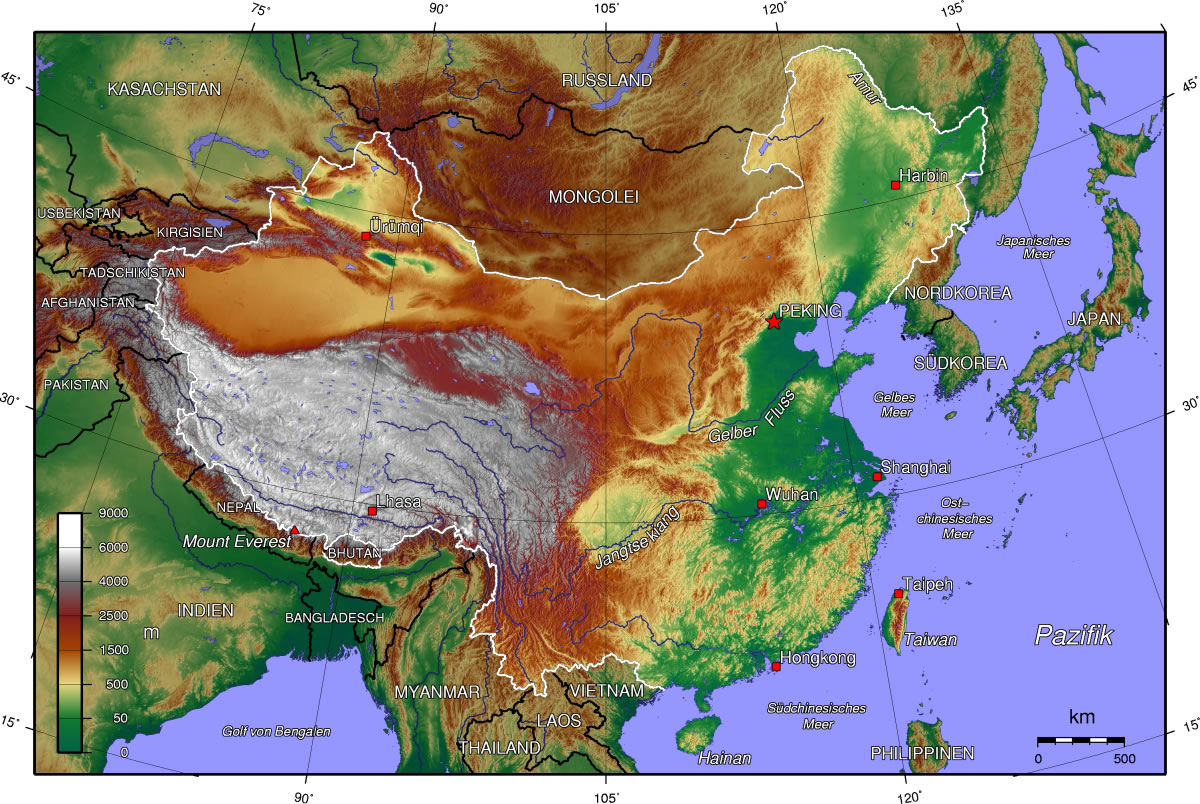
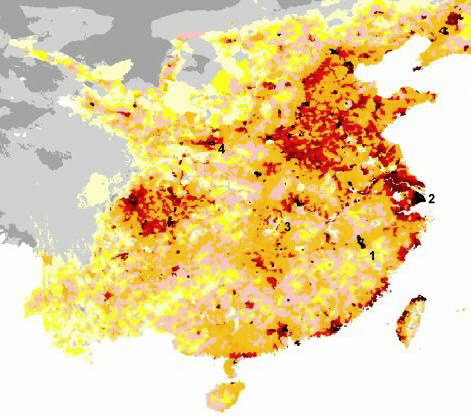
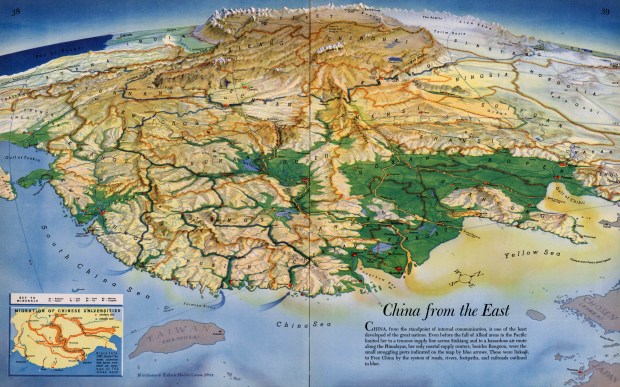
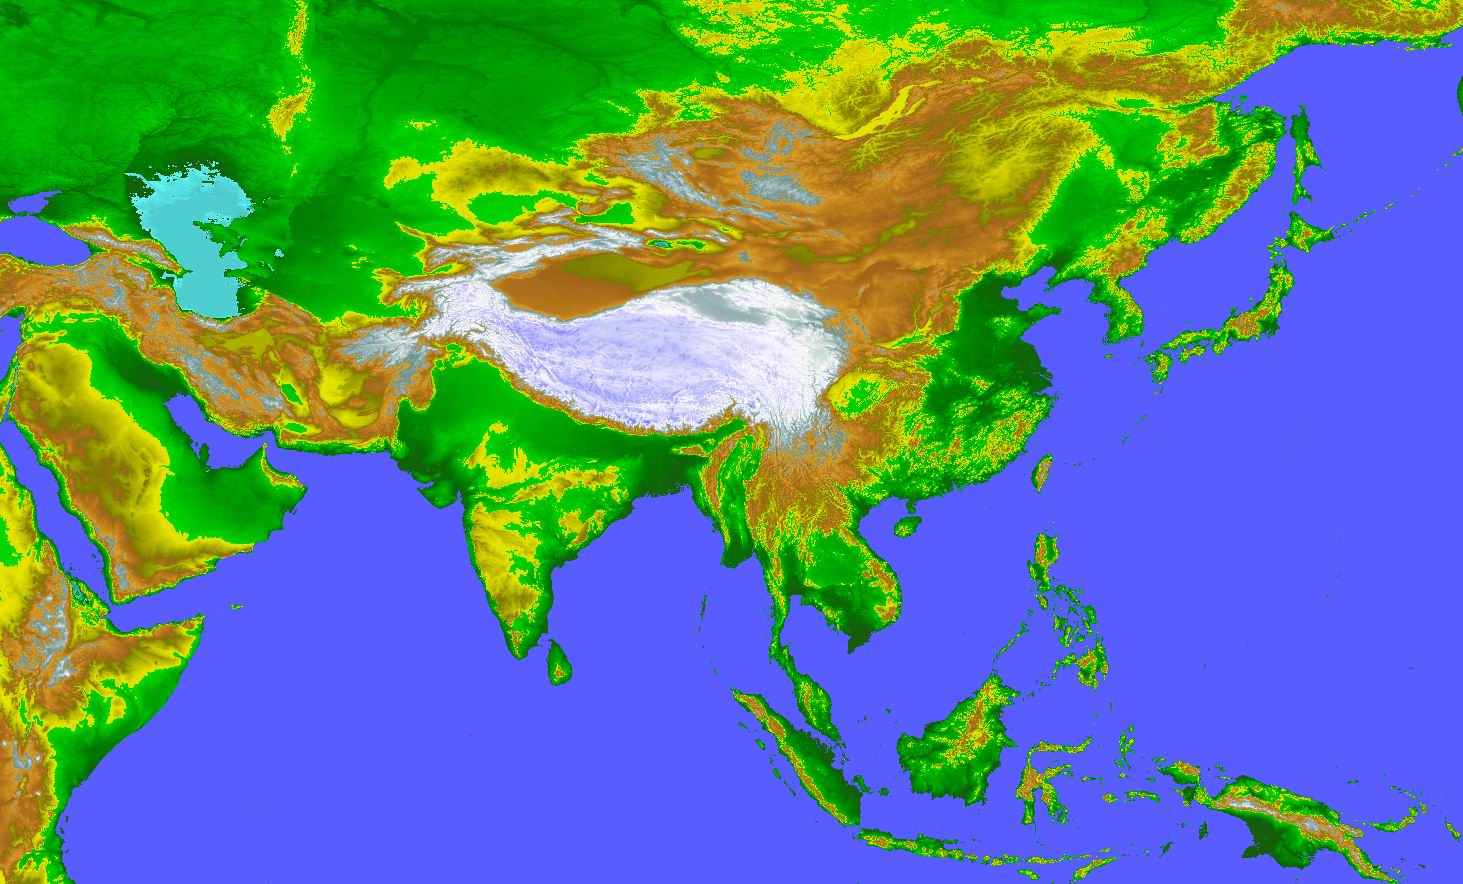
See that red circle in the centre of China’s population density map (pictured below), and the greenish-yellow circle in the centre of China’s physical topography map (pictured below that)? That is the Sichuan basin, which consists of the province of Sichuan (population 81 million) and the city-state of Chongqing (population 30 million).

2BCKPUB

Topographic-map-of-China-2005

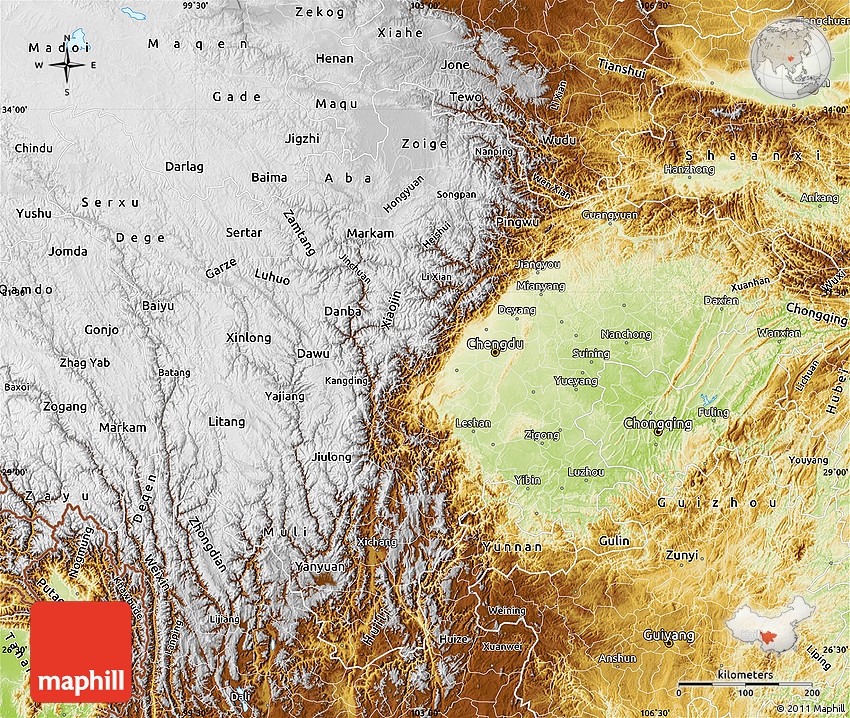
Close up topography of the Sichuan basin and surrounding areas: 

Physical map of Sichuan.

To the west of the Sichuan basin is the sparsely populated Tibetan plateau, which is more than 4000 metres higher above sea level than Sichuan is (to put that into context, the tallest building in Manhattan is only 540 metres tall). South and southeast of Sichuan there are mountains and plateaus that are about 1000 metres higher than Sichuan. To the east there are also mountains, which separate Sichuan from the middle reaches of the Yangtze River valley, where the elevation is about 350 meters below that of Sichuan. And to the north there are a series of high mountain ranges and narrow valleys that have historically helped to insulate Sichuan from the northeastern coastal plain where most Chinese people live.

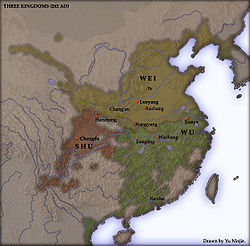
The Sichuan basin’s geographic insularity and large population (larger than any single Chinese province) have historically made it one of China’s more independent-minded regions. In the 3rd century AD, for instance, during China’s famous Three Kingdoms era, a state basically corresponding to modern-day Sichuan was one of China’s three independent political entities (see left map below). A somewhat similar thing occurred in the 10th century AD (see right map below).

250px-China_5Five_Dynasties_Ten_Kingdoms_923_CE

More recently, Sichuan played a significant role during the Xinhai Revolution just prior to WW1, which overthrew China’s last emperor, and during the “Warlord Era” which followed it. Sichuan then became a critical component of the Communist Party’s rebellion against the ruling Chinese Nationalists during the Chinese Civil War from 1927 – 1950. Mao’s infamous “Long March” went through the outskirts of Sichuan province, for example, and one of the two largest original Communist armies during the Civil War, led by Mao’s rival Zhuang Guotao, was based there as well. Finally, after the Communists turned the tables on the Nationalists, gaining the upper hand in the Civil War, Sichuan ended up becoming the last base of the Chinese Nationalist leadership prior to its retreat to the island of Taiwan in 1949.

mainmap

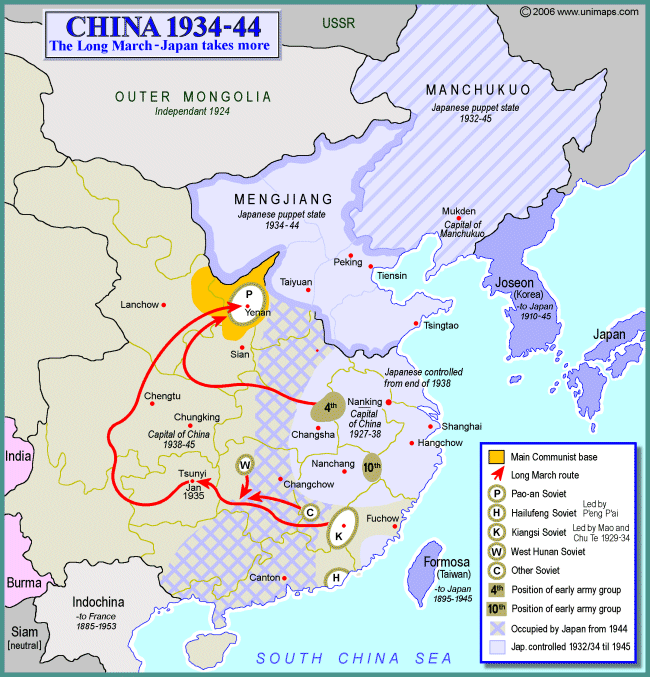
Sichuan, in other words, often became a centre of resistance against whichever group, whether Chinese or foreign, happened to be ruling China at the time. Indeed, when the Japanese controlled much of China during WW2, Chongqing even became the official capital city of the parts of China that were still free of Japanese control (see map above). Much more recently, during the protests of 1989, there were actually two, rather than just one, major government crackdowns: one in Beijing’s Tiananmen Square, which most people in the West have heard of, and the other in Sichuan’s capital city of Chengdu, which very few people have heard of.

While it is difficult to speculate on the extent to which the Sichuan region may become a nuisance for China’s central government in the future, there have arguably been some troubling signs of late. Most notably, the two most prominent “purges” of high-ranking Communist Party leaders in recent times were both from the Sichuan basin.

The first was Bo Xiliai, the leader of Chongqing, who many had thought might become China’s next top leader, but instead was exiled from the Communist Party and given a life sentence in prison on a corruption charge in 2012, following a curious, alleged incident involving his wife, the Chongqing chief of police, and the murder of a British businessman.

The second was Zhou Yongkang, the former leader of Sichuan province, who was arrested on corruption charges in late 2014, only a few months ago, becoming the first member of China’s seven-person Politburo Standing Committee (the top leadership of the entire country) to be expelled from the Party since the 1980s. Many of Sichuan’s other top leaders have recently been targeted by the central government on corruption investigations as well, because of their associations with Zhou. Of course, the fact that Bo and Zhou were both the most powerful modern leaders the Sichuan basin has seen might just be a coincidence, having more to do with personal politics within the Communist Party than regional geopolitics within China as a whole. But it is somewhat suspicious nonetheless.

201301291057565481

Politically, in spite of the region’s large population, not one person born in Sichuan or Chongqing currently holds a position in any of the 43 positions in the Communist Party’s Politburo, Secretariat, or Central Military Commission, at or around the top levels of China’s political hierarchy.

And yet, all of the previous recent Communist Party leaders of Chongqing (none of whom were actually born in the region) have gone on to some of the top jobs in the entire country. Three of the past four have even become members in China’s Politburo Standing Committee, the 7-man group which de facto holds the highest Party positions of all. And before them, Deng Xiaoping, by far the most infamous post-WW2 Chinese leader apart from Mao, served as Mayor of Chongqing, and was born in one of its suburbs. (Though in Deng’s day Chongqing was more important in China than it is today, since its insular location had allowed it to serve as the capital city of “Free China” during the Japanese occupation of eastern China in WW2).

The promotion of former party chiefs of Chongqing (but not Sichuan, even though Sichuan is much larger) to top positions in the central government in Beijing might also be just a coincidence. It does, however, seem suspiciously like a divide and conquer tactic the government has been using to keep Sichuan and Chongqing apart, by winning Chongqing’s favour. Chongqing holds a particularly strategic position, as it is the spot where the Yangtze River flows out of the mountain-enclosed Sichuan basin, entering into the rest of central China and eventually reaching Shanghai on the Pacific.

Indeed, the reason Chongqing was even made a city-state to begin with — one of only four city-states within mainland China, the others being Beijing, Shanghai, and Beijing’s port city of Tianjin — may be because China’s leaders were worried about having to deal with a politically united Sichuan basin, which prior to Chongqing’s independence from Sichuan in 1997 had been China’s most populous province. This is probably also why the “Municipality” of Chongqing, unlike those of Shanghai, Beijing, or Tianjin, is the only one to have been given large rural areas around it to govern, so that it controls a population of 30 million even though its urban areas are home to around just 10 million.

The current Party chiefs of Chongqing and Sichuan are two of the youngest in the entire country. They are 51 and 58 years old, respectively; most other provincial party chiefs in China are in their sixties or seventies, and the 51-year-old Chongqing leader is actually the youngest of all 25 current members in the country’s Communist Party Politburo. Having the youngest provincial party chiefs or governors is usually not a good sign, since Beijing tends to pick the youngest, most ambitious governors for areas it is most concerned with, the idea being that such governors will be willing to do whatever is necessary in order to maintain order, so that they can later be promoted to one of the Communist Party’s highest offices. Hu Jintao, for instance, had served as the party chief of Tibet prior to becoming a major political figure. Indeed, we will continue to see the pattern of relatively young and ambitious party chiefs and governors in the other potentially trouble-making regions we will discuss in this article.

Finally, also notable is the Sichuan Earthquake of 2008. The earthquake, the epicentre of which was only about 80 km from Sichuan province’s main city of Chengdu (population 14 million), killed an estimated 80,000-90,000 people and caused an enormous amount of physical injury and property damage, leaving 5 – 15 million people homeless. It is one of the deadliest natural disasters in the world in modern times, and the deadliest in China in over three decades. By comparison, that is about 20,00 more casualties than the United States experienced in Iraq, Afghanistan, and Vietnam combined.

The Sichuan earthquake was mostly overlooked by people in the West, not only because it took place deep within the unknown Chinese interior, but also because it was overshadowed by a flurry of notable world events that took place during the months immediately following its occurrence, such as the global financial crisis, the first Obama election, the Beijing Olympics, the Russian invasion of Georgia, the first Israeli war against Hamas in Gaza, and the Mumbai terrorist attacks. The same week as the earthquake, in fact, California became the second US state to legalize same-sex marriage, and the debate discussion of this decision even got much more American news coverage than the disaster in Sichuan did.

The earthquake was, however, obviously an event of huge importance within China, and it is still quite fresh in some people’s minds. Its tenth anniversary will be approaching in 2017, the same year as China’s once-a-decade top leadership changeover. Crucially, many Chinese people believe that the central government are at least partly to blame for the earthquake (though it is difficult to know how many people believe this, given Chinese censorship). This is because the government created the gigantic nearby Three Gorges Dam, which finished being constructed just prior to 2008, and many think the weight of the dam – which can produce almost twice the electricity of any other dam in the world – and the reservoir of water it created was the catalyst for the earthquake. (Even before the earthquake, the Dam crushed the previous record for people displaced from their homes by a hydroelectric plant: the number of displaced Chinese was estimated at more than 1.2 million people, most of them from the province of Hubei, which directly borders the Sichuan basin).

And the thing about earthquakes is, of course, that you never fully know when another one is going to happen. If a second large one were to occur and affect Sichuan, it could bring back the memory of 2008 – and potential Sichuanese anger with the central government  – along with it. In fact, this may have already happened to a certain extent: China’s highest-magnitude earthquake since the Big One in 2008 occurred again in Sichuan, in 2013, only about 115 km from Chengdu. It killed an estimated 200 people (according to the Chinese government) and injured more than 10,000.

Southeastern China —  Population 154 million

350px-SoutheastChina

In a previous article, we discussed a large number of differences between southern China, where nearly all of the country’s tens of millions of ethnic minorities and hundreds of millions of linguistic minorities live, and northern China, where most of the country’s enormous majority of ethnic Chinese and Mandarin speakers live. So we will try to repeat only some of the basic facts of the region that were discussed there, and then focus specifically on why this part of China could potentially become the most problematic region for the Chinese central government to handle.

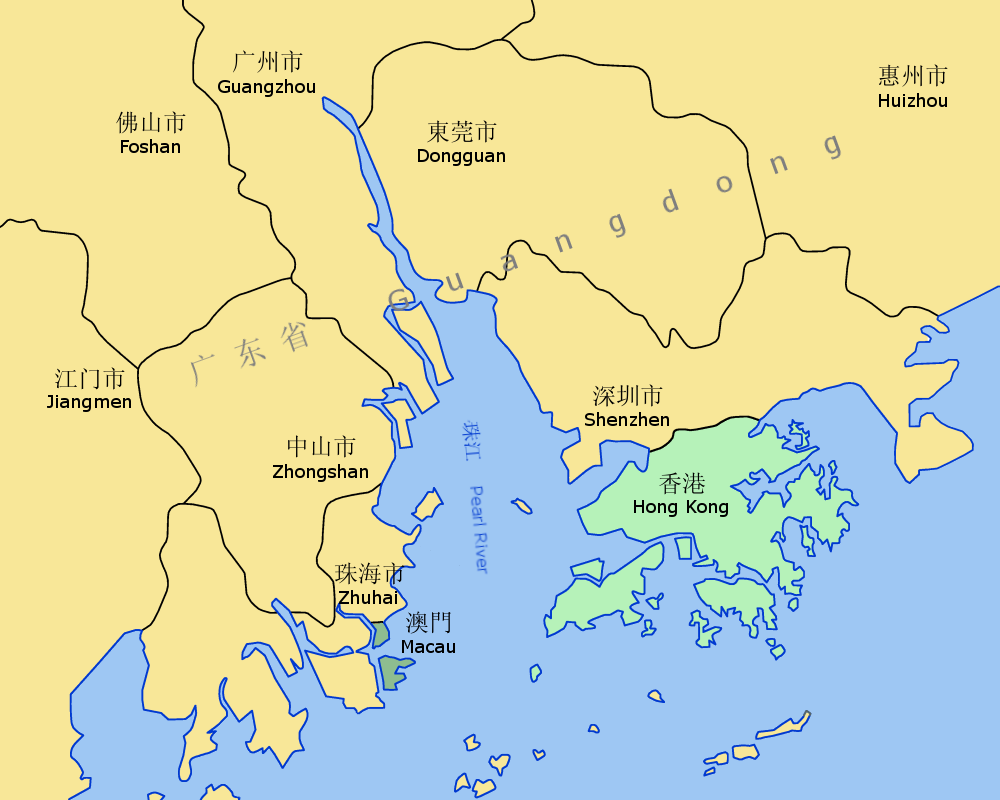
Southeastern China consists basically of three provinces: the province of Guangdong (population 107 million), which has the largest population and economy of any Chinese province, and which is the only province which borders Hong Kong; the province of Fujian (population 38 million), which is located directly across the 180 km long Taiwan Straits from Taiwan, speaks the same dialect of Chinese as is spoken in Taiwan, and, in spite of having less than 3 percent of China’s total population, accounts for perhaps 15 percent of all China’s trade with Taiwan (and China trades roughly 40 percent as much with Taiwan alone as it does with the entire US); and finally the province of Hainan (population 9 million), which is the only island province in China. The first bridge linking Hainan to the Chinese mainland (specifically, to Guangdong), is supposed to be finished between 2016 and 2020, and is likely increase Guangdong’s level of influence on the island.

As you can see from the population density map below, southeastern China is very different from northern China, in that its population centres are almost entirely situated on the country’s Pacific coast. The reason for this is that southern China, unlike northern China, has a very difficult climate and topography to deal with – it is extremely hilly, mountainous, often forested, and sub-tropical (see the other two maps below) – so that its population has moved to the only places where economic development was not extremely difficult to achieve, namely the narrow coastal flatlands that sit next to its numerous natural harbours.

China_density-pop

images

or, for a different perspective of the topographic differences between southeastern China and central-eastern China:

1941_China_from_the_East

Because southern China’s challenging geography has tended to impede internal movement of people and goods – especially in the past, but to a decent extent also in the present – southeastern Chinese coastal cities have also become relatively close to, and dependent on trade with, the outside world, with foreign economies like Japan, the United States, Canada, and Europe, as well as with Taiwan. The relationship between Hong Kong (population 7.2 million) and Britain is of course the most obvious and significant example of this, but it is not the only one. Macau (population 600,000), for instance, on the borders of Guangdong, is a former Portuguese territory that is China’s only “Special Administrative Region” apart from Hong Kong. Macau is also by far the wealthiest of any political subdivision within China, with a per capita nominal income of more than $90,000.

Pearl_River_Delta_Area

According to the Economist, Guangdong and Fujian alone account for 30-40 percent of all Chinese exports. Most of China’s gigantic global diaspora – which is 50 million strong, perhaps, and is located all over the world, but particularly in places like North America, Australia, Peru, and especially Southeast Asia – is also from Southeastern China. In fact, it has been estimated that one out of every seven Chinese Americans have their roots in the Guangdong area of Taishan, even though Taishan itself only has around 1 million inhabitants today. More recently, in the 1980s, emigrants from Taiwan and Hong Kong came to countries like the US and Canada in very large numbers. If, therefore, globalization forces continue to deepen, and if the economies of Southeast Asia and Taiwan continue to emerge, it could have a huge influence on this part of China, in a sense pulling it away from the rest of China.

Southeast Asia alone is home to an estimated 27 million Chinese people (though admittedly, these statistics vary widely depending on which numbers you trust, and on which criteria you use to define who is and is not “Chinese”, since many have been living in Southeast Asia for many generations now). Southeastern China also directly borders a potentially rapid-growing Vietnamese economy, the capital city of which, Hanoi, is only about 100 -150 km from the southeastern Chinese border, only 400 km from Guangdong’s enormous capital city Guangzhou and Hong Kong, and only 250 km from the Chinese island province of Hainan.

vietnam-map

Along with the adjacent provinces of Hunan, Jiangxi, and Zheijang, Southeastern China also has by far the most intra-Chinese linguistic diversity in the country. In it, non-Mandarin Chinese languages are spoken by an estimated 300 million people (though increasingly, most people are also able to speak the standardized, Beijing-region dialect of Mandarin) — see map below. Like Sichuan, this region has also been politically disenfranchised to a certain extent, with not a single one of China’s 43 positions in the Party’s Politburo, Secretariat, or Central Military Commission held by someone born in Guangdong or Hainan, and only one held by someone born in Fujian. Currently Beijing has also given Guangdong the second youngest party chief (aka party secretary) in the country, a 51-year-old who has spent most of his career working in Tibet.

240px-Sinitic_Languages0

Recently, this region has also been slowing economically as a result of the effect that Europe’s and Japan’s stagnant economies have had on demand for its exports. As a result, and also given the recent (and perhaps ongoing) protests in neighbouring Hong Kong, the province of Guangdong should be watched very closely at this time.

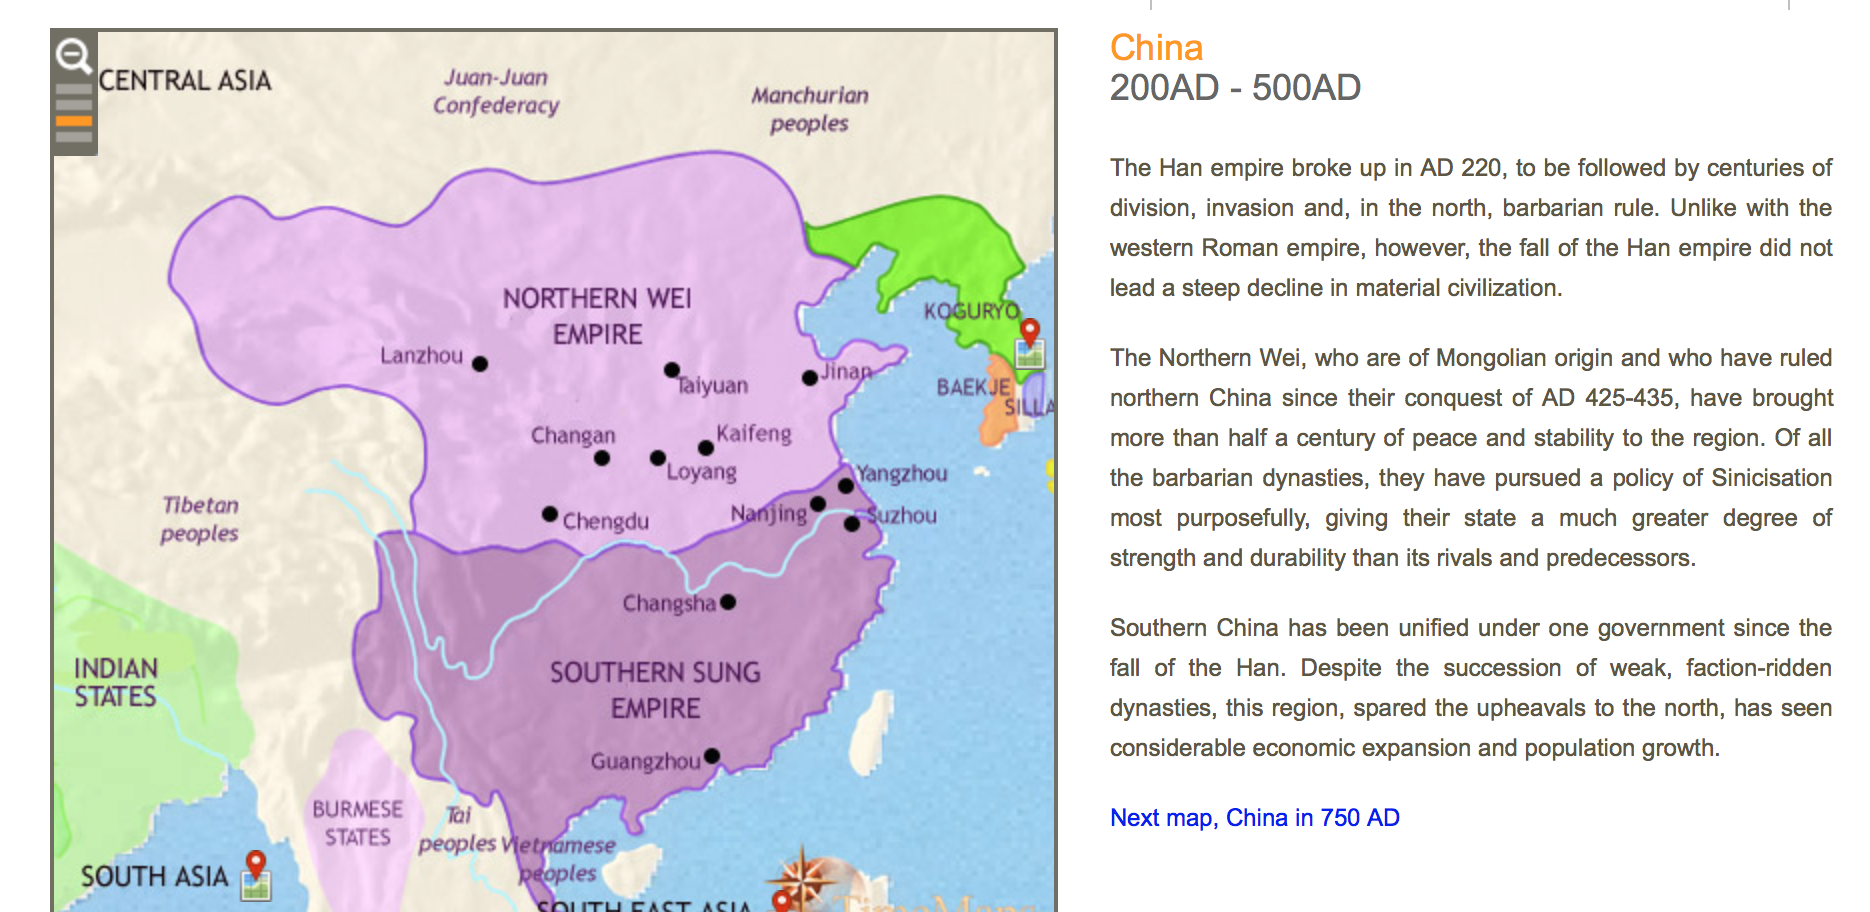
Historically, to be sure, Southeastern China has been a huge pain for Chinese central governments. From roughly 200 AD to 500 AD and from 1000 AD to 1200 AD, for example, there was a general north-south political divide in China (see maps below).

china 900 china 200

In modern times, during the anti-emperor Xinhai Revolution prior to WW1, Guangdong and Fujian were two of the original centres of the revolution. Later, in 1925, the Chinese Nationalists (the Kuomintang) set up an alternative Chinese capital city in Guangzhou, Guangdong, and from it successfully led a campaign to overthrow the government in Beijing, at which point the Chinese capital was moved to Nanjing (next to Shanghai).

Only a few years after that, in 1930, there was a very deadly civil war within China, the Central Plains War, which among other things pitted Nationalist leader Chiang Kai-Shek, who was ruling out of Nanjing, against Hu Hanmin, who had the support of the Nationalists across Guangdong and the rest of southern China. This rivlary had in fact been presaged by an earlier one in 1922, when the top Nationalist leader at the time, Sun Yat Sen, was forced to flee Guangdong from a different, more regional-minded Nationalist leader, Chen Jiongmin.

Around the same time, the Guangdong capital of Guangzhou was also one of the main bases of the Communist movement in China. The Communists were gaining momentum across various parts of southern China: in 1933, just to give one example, an alliance between a portion of the Communist movement and a portion of the Nationalist movement emerged, leading to the Fujian Rebellion: the creation a self-governing leadership in Fujian province that aimed to overthrow the Nationalist Chinese government of Chiang Kai-Shek. The provinces of Hunan and Jiangxi, directly on the border of Guangdong, also became very important for the Communists.

Finally, when the Communists took over and were about to win the Chinese Civil War, Guangdong became the final base – along with Sichuan – of the Nationalists prior to their retreat to Taiwan.

While it is probably unwise to make generalizations about Chinese history, there does seem to be a bit of a pattern here: Guangdong, or more broadly southern China, tends to resist centralized Chinese leadership. It has always seemed to lead the anti-government movements in the country, whether it be the anti-imperial uprising against the Qing Dynasty at the begining of the 20th century, the Nationalist move to overthrow the Beiyang government (which had replaced the Qing) in the Northern Expedition, the attempt by regional leaders within the Nationalist movement to get rid of the Nationalist central government of Chiang Kai-Shek that ruled out of Nanjing, the emergence of Communist movements opposed to the ruling Nationalists (with whom they had previously been allied), or, finally, the retreat and resistance of the Nationalists in the face of the ruling Communists.

chinese_provinces-map

The thing which makes southeastern China so potentially difficult for the central Chinese government, however, is not so much its history as it is its wealth. If you take Guangdong and Fujian, and add in neighbouring Taiwan, Hong Kong, Zheijang, and the Municipality of Shanghai (and we will discuss Shanghai later in part two of this article), you get a coastal region with a GDP that, as recently as 2009, was approximately 80 percent as large as the rest of all of mainland China’s other provinces put together.

Such wealth not only gives southeastern China economic influence, but has also made its internal politics complicated – and potentially dangerous – through the creation of divisions between the native inhabitants of the region’s cities, and the migrants from its rural areas and from the rural areas of poorer Chinese provinces, who are in search of work in its cities. Guangdong alone has an estimated 27 percent of China’s inter-provincial migrant population. And in China, “rural-urban” is not only a geographic or demographic distinction, but also a legal designation with significant  financial and social implications. Rural Chinese populations, even when they have moved to urban areas, are generally denied many of the social services, such as subsidized housing or education, which are provided for the native urban populations.

Finally, parts of central-eastern and southeastern China in recent years seem to have become the main centres of China’s potentially enormous transition toward Christianity. Today, according to the Economist, arguably more than 100 million people in China are Christian, up from perhaps as few as 15 million as recently as the 1990’s. If these numbers are accurate, then the growth of Christianity within China during the past two decades represents one of the largest religious adoptions in all of human history. The Economist more recently argued that the relationship between Christianity and the Communist Party in China has been becoming much more tense  in the past year.

Neighbouring Hong Kong has long had a significant Christian population, meanwhile, and remains around 10-15 percent Christian today. A number of the Hong Kong protest organizers were practicing Christians, in fact. And, notably, the Chinese government may have begun to crack down on parts of this growing Christian religion within China during the past year or so.

Southwestern China Population: 120 million

Southwestern China (containing the provinces of Yunnan, Guizhou, and the “Autonomous Region” of Guangxi, one of only two Autonomous Regions apart from Tibet, Xinjiang, and Inner Mongolia) is by far the most mountainous of any populous Chinese region. Partly as a result of this, it also has by far the most ethnic diversity in the country, with a regional population that contains tens of millions of non-Chinese peoples (most notably the 15 million or so Zhuang ethnic group), some of whose homelands extend across the Chinese border with Southeast Asian countries like Myanmar. Like the other regions discussed so far, southwestern China has historically been a challenge for Chinese central governments. During the 1950’s, for instance, in the largest southwestern province, Yunnan, an anti-Communist Islamic guerrilla insurgency took place, orchestrated in part by the Nationalists who were ruling Taiwan. Today, as in Guangdong or Sichuan, not one person who was born in southwestern China is currently serving within the highest echelons of the Chinese government.

se-asia-map_ethnicgroup

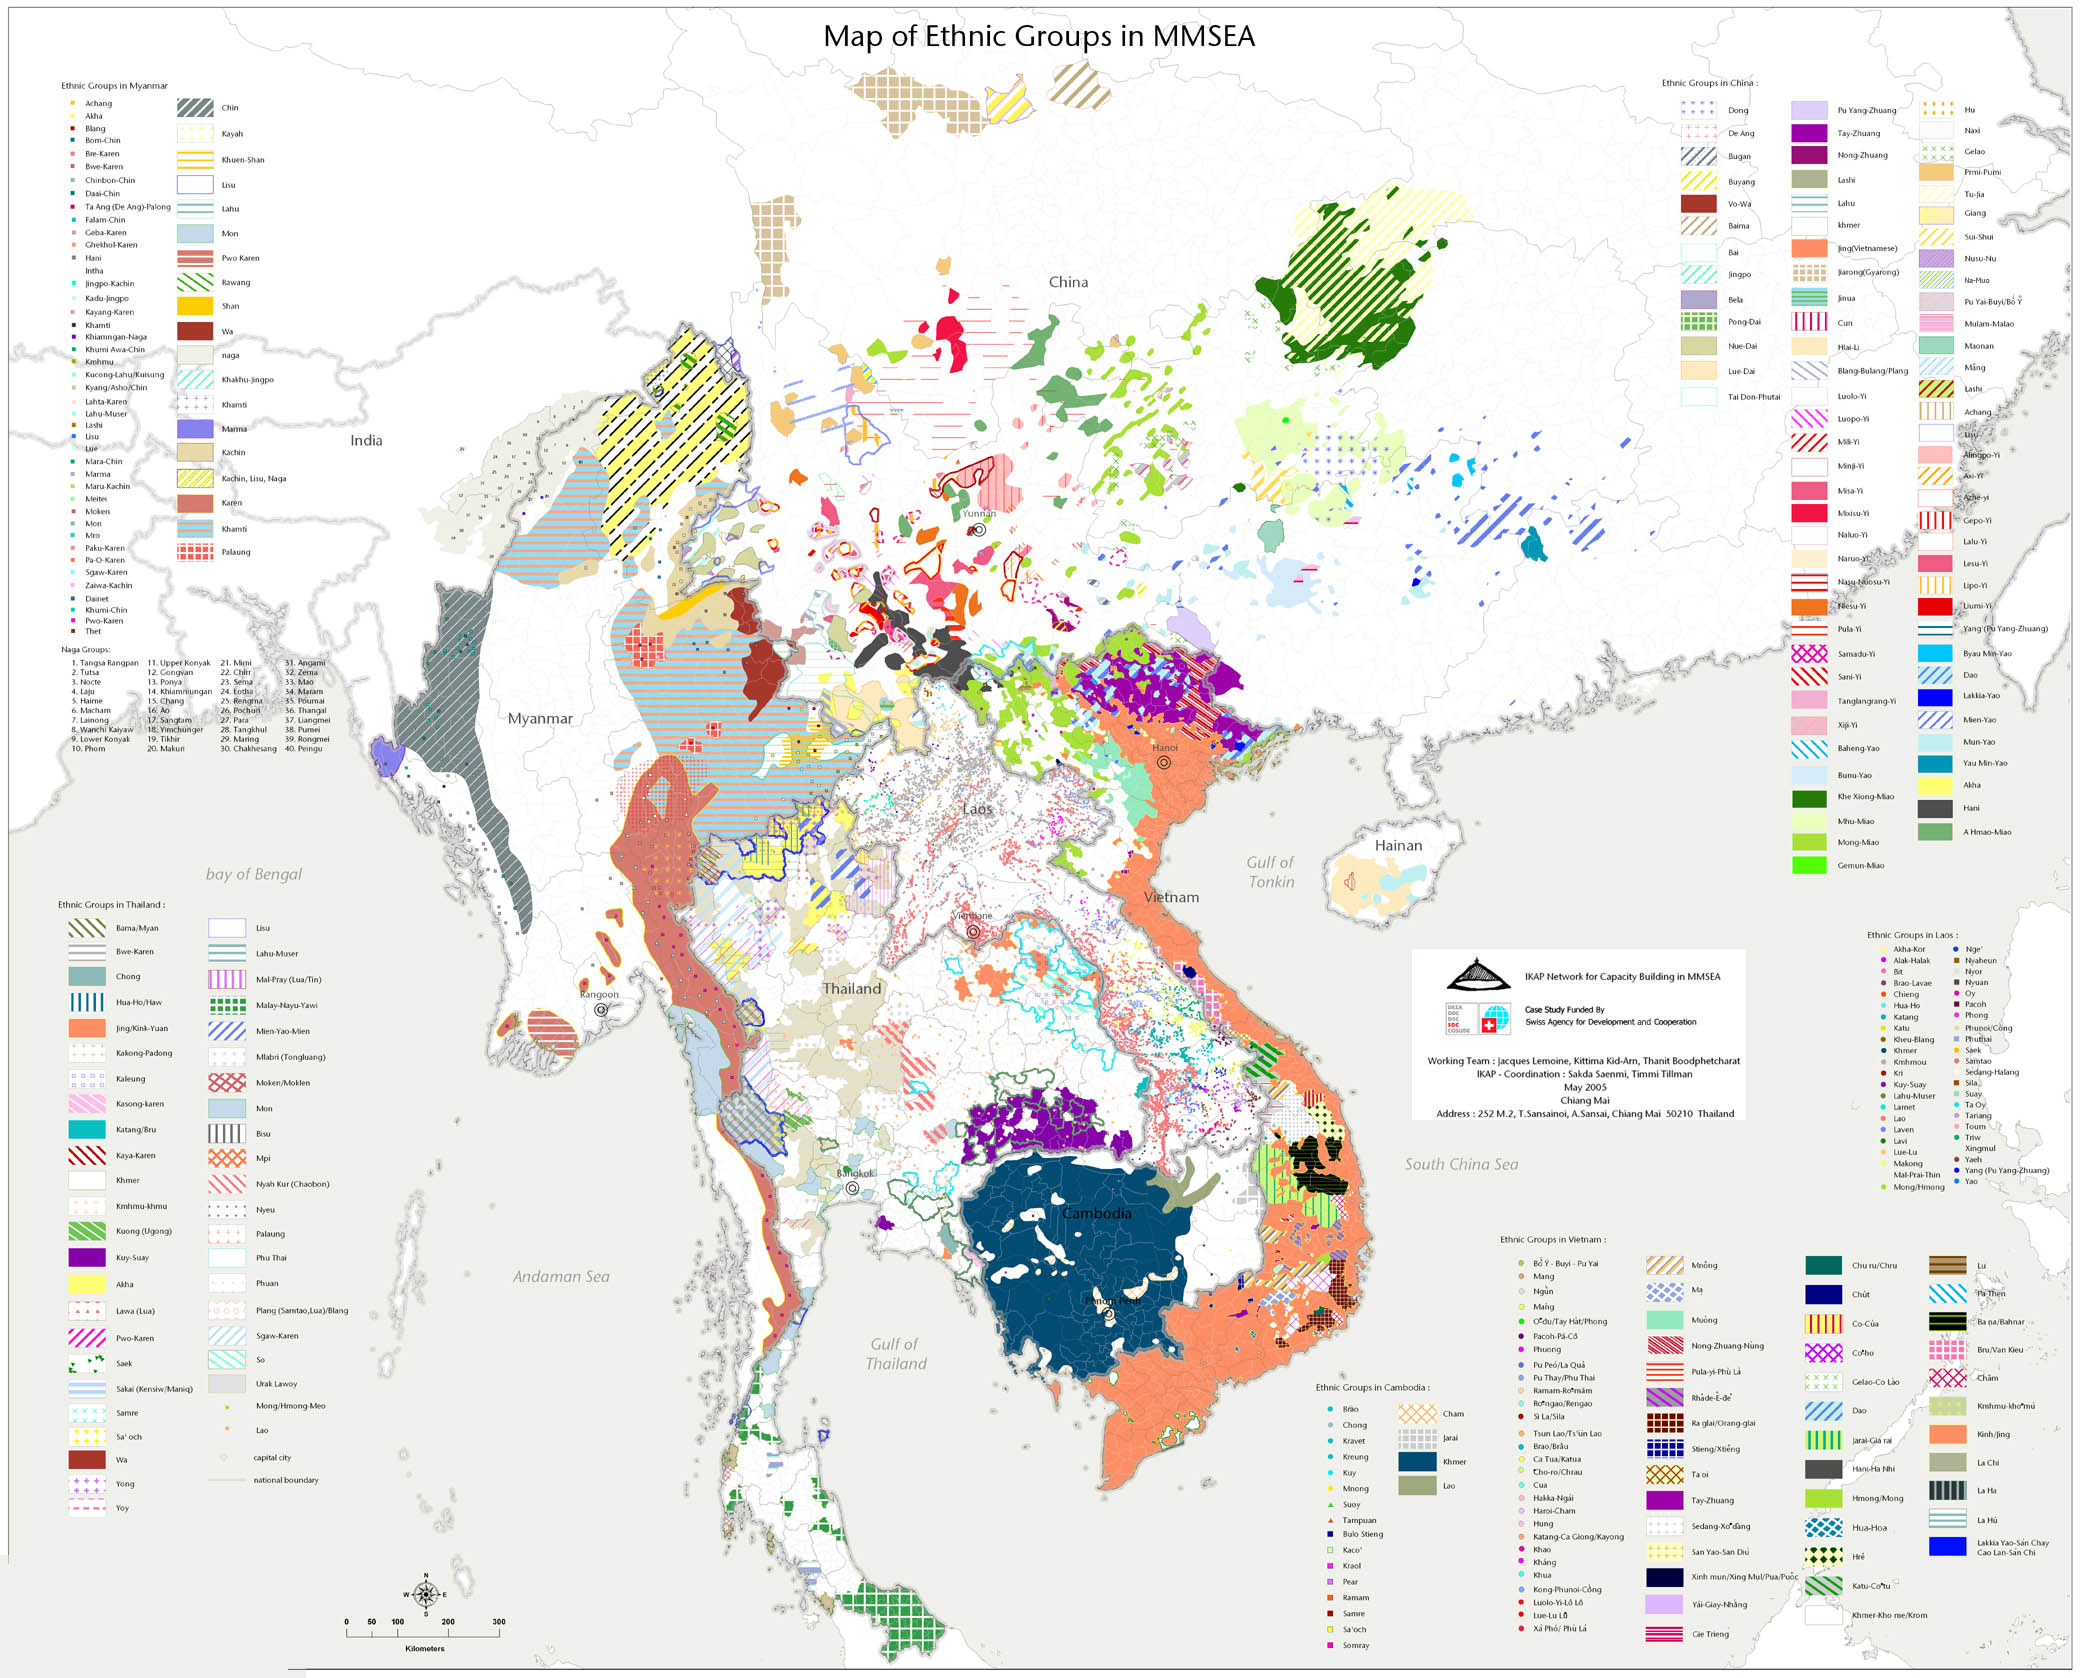
Southwestern China is the only part of China to border most of Southeast Asia. It could in the future become particularly close with the northern part of Vietnam, which is nearby, populous, and can serve as an alternative route for southwestern Chinese goods to reach the Pacific. It could also become close with Myanmar, which can serve as a direct route for it to reach the Indian Ocean via the commercially navigable Irrawaddy River (see map below), or to reach India and Bangladesh overland without having to cross the virtually impassable Himalayan Mountains and Tibetan Plateau (see other map below). Notably, Vietnam and Myanmar have seen a great deal of economic growth in recent years, and Myanmar has politically been re-opening itself to the West after decades of isolation. Economic interaction between Southwestern China and these potentially emerging countries could present some challenges for the Chinese central government.

mapasia

In addition, and also potentially troubling for the Chinese central government, the region of southwestern china also has ties to southeastern China via the Pearl River, which is by far China’s longest commercially navigable river apart from the Yangtze, and which meets the Pacific at the place where Hong Kong and Guangdong’s capital city of Guangzhou are located (see map below). Southwestern China also directly borders both Sichuan and Tibet.

Zhujiangrivermap

(In the graph above: Kunming, Guiyang, and Nanning are the capital cities of Southwestern China’s provinces. The Greater Guangzhou-Hong Kong area in Southeastern China, which has a total population of perhaps more than 50 million, is arguably the most populous urban area in the entire world)

In part two of this article we will take a look at Shanghai, Xinjiang, the former Manchuria, and Inner Mongolia. 

America’s Domestic Environmental Geopolitics

In an op-ed in the New York Times earlier this month, economist Paul Krugman asks the question: why have the Republicans moved so far to the right on the environment, going from the introduction of the Clean Air Act of 1970 during the Republican Nixon administration (which passed the Senate, as Krugman points out, “on a bipartisan vote of 73 to 0”), and from the relatively eco-friendly amending of the Clean Air Act during the Republican George Bush Sr. administration in 1990, to the climate change denying, regulation-opposed strands of today’s Republican Party?

Krugman provides a possible answer to his question, writing: “[climate change denying] ideology is only part of the story — or, more accurately, it’s a symptom of the underlying cause of the divide: rising inequality. The basic story of political polarization over the past few decades is that, as a wealthy minority has pulled away economically from the rest of the country, it has pulled one major party along with it. True, Democrats often cater to the interests of the 1 percent, but Republicans always do. Any policy that benefits lower- and middle-income Americans at the expense of the elite… will face bitter Republican opposition. And environmental protection is, in part, a class issue, even if we don’t usually think of it that way. Everyone breathes the same air, so the benefits of pollution control are more or less evenly spread across the population. But ownership of, say, stock in coal companies is concentrated in a few, wealthy hands. Even if the costs of pollution control are passed on in the form of higher prices, the rich are different from you and me. They spend a lot more money, and, therefore, bear a higher share of the costs.”

Income inequality may indeed be the most significant aspect of this story, as Krugman says. Yet there might be some other explanations to this question as well, ones that do not have to do with general shifts in income distribution or political ideology, but rather with specific changes that have occurred to the economic geography and voting patterns of the United States during recent decades. Here are 10 such additional guesses as to why American environmental politics have become more divisive today than they were in previous generations.

1) US Coal Production Moves West 

The United States has by far the largest coal reserves in the world, is by far the largest coal producer in the world apart from China , and was a larger coal producer than China as recently as the 1980s. As you can see from one of the graphs below, US coal production used to come from states located to the east of the Mississippi River (notably, from West Virginia, Kentucky, Illinois, Pennsylvania, Indiana, and to a lesser extent Ohio), but has since moved to states west of the Mississippi — mainly to Wyoming, a state which now accounts for almost 50 percent of all coal production in the United States. To a lesser extent, it has also moved to Montana (which borders Wyoming), North Dakota (which borders Montana), and Texas.

US coal production has moved, in other words, from a number of states that have historically tended to vote Democrat or are swing-states — three of which, Illinois, Pennsylvania, and Ohio, are among the most populous states in the country, and therefore carry more weight in elections — to a single state, Wyoming, which has almost always voted Republican and has literally the smallest population of any state in the country (though, because of coal, Wyoming also has the second highest per capita income of any state). Coal-producing Montana and North Dakota also have been firmly Republican states for decades, and also have relatively tiny populations. The Democratic Party no longer has even close to as much of a political interest in the coal industry as it used to, therefore. Indeed, while states like Illinois and Pennsylvania continue to produce a decent amount of coal today, their economic growth over the past few decades has meant that the value of this coal production as a share of their state GDP’s has dropped by a significant amount.

In contrast, coal production does remain a critical component of the smaller Midwestern economies of Kentucky and especially West Virginia. It is not too surprising, then, that West Virginia and Kentucky have not voted for a Democratic president since 1996. While Kentucky was always something of a swing-state, West Virginia actually used to be a staunchly Democratic state back in the days when the Democrats’ interests were more closely aligned with coal production. West Virginia voted for the Democrats in every presidential election but one between 1956 and 2000; in fact, as recently as the 1980 election it was one of only four states in the entire country to vote for the Democrats.

Meanwhile, as the graphs below also show, coal production has moved from underground mining to surface mining (which tends to be much more environmentally intrusive than underground mining), from producing bituminous coal to producing sub-bituminous coal and lignite (which are much more environmentally inefficient to transport and burn than bituminous coal is), and from being labour-intensive to being far less labour-intensive (meaning that there are fewer coal labourers around who might be inclined to vote against environmental protection; this is probably also one of the reasons West Virginia votes for the Republicans nowadays).500px-Fig_7-2_Coal_ProductionWV_Employment_vs_Production

toptwo

2) Texas and California Switch Parties 

Today it seems hard to imagine that Texas would ever vote for the Democrats, or that California would ever vote for the Republicans. But that it is how it used to be. Prior to Bill Clinton, no Democratic President had ever won an election without Texas. In the presidential elections of 1964, 1956, 1952, and 1948, Texas actually voted for the opposite party as most of the rest of “the South” voted for, and in every presidential election from 1952 until 1988, Texas voted for the same party as New York voted for. California, meanwhile, voted for the Republicans in every presidential election from 1968 until 1992 (there were fewer Latino-Americans, white liberals, and other minority groups over the age of 18 in California back then); in fact, the most recent non-Bush Republican presidents, Reagan and Nixon, both came from California.

As Texas has become firmly Republican and California firmly Democrat, environmental politics have become more politically polarized, since California consumes the third least energy per capita of any US state (and also understands the dangerous power of the environment, as its population faces significant drought, earthquake, flooding, and forest-fire threats), while Texas uses the sixth most energy per capita of any state, and exports by far the most energy in absolute terms of any state apart from Wyoming. Texas is the US’s largest oil producer by far, its largest natural gas producer by far, and its sixth largest coal producer.

3) Declining California and Florida Oil Production

Back when it was a Republican-leaning swing-state, California was one of the country’s leading oil-producing states (it is actually still the third largest oil producer in the US). Oil production used to account for a much larger share of the Californian economy than it does today; however, since the mid-1980s, California’s energy production has gone down and down (see graph below) while its GDP has gone up and up because of its leading role in sectors like technology, tourism, entertainment, and real estate. Though California did briefly look like it might become a major player in the US’s recent shale oil production boom, that no longer seems likely to occur.

Because California is now so crucial to the Democrats (not only in the electoral college, but also financially and in terms of media influence), the Democrats might have had an incentive to be less environmentalist if California’s economy still depended on oil production to the same extent that it used to. (As California’s population has grown so much, it now also faces greater environmental challenges, such as droughts, than it used to, which has also made it more afraid of climate change, and therefore more in favour of environmental protection). If California was still willing to vote Republican, meanwhile, the Republicans might have an incentive to be more environmentalist. California, after all, has 12 percent of the US population and 14 percent of US GDP, both much larger figures than any other US state has. Thus, economic changes and voting patterns in California have probably contributed somewhat to making US environmental politics more divisive.

A similar trend has also occurred in some other important states. Florida, for example, which in the past few decades has grown to become the third most populous state in the US, has seen oil production fall by an astounding 95  percent or so since its peak production in 1978. It too has become a Democrat-voting state more often than it used to, also because of demographic changes. The same is true of Illinois, New York, and a few other states that have not taken part in the “shale revolution” oil production surge of recent years.

California-Energy-Production-All-Sources-Trillion-BTU-1960-2010

oil-prod-graph

florida oil production

New York Oil Production

4) Rising Energy Prices 

Prior to 2014, the past 15 years or so saw oil and coal prices rise by a very large amount. This rise had a polarizing political effect, since, for the states which produce the most energy per capita (virtually all of which are Republican or swing-states), such as Wyoming, North Dakota, Louisiana, Alaska, Montana, Texas, West Virginia, Oklahoma, Utah, and Arkansas, energy production became more profitable, while, for many of the states which do not have much energy production per capita (most of which are Democrat or swing states), such as New York, Florida, New Jersey, Minnesota, Michigan, or Massachusetts, it became increasingly worthwhile to improve energy efficiency and/or increase alternative energy production or natural gas consumption.

Energy efficiency has also been occurring as a longer-term trend in the US (see graph below); it accelerated in some states as a result of rising energy prices in the past decade, but had already started long before that in the country as a whole. Rising energy prices also caused economies like Western Europe and Japan to become more energy-efficient and committed to alternative energy production in recent years, providing an example for many Democrats to aspire to.

Consumpt vs GDP

5)  Rising “Unconventional” Oil Production 

Partly as a result of higher oil prices – not only in the 2000’s, but also in the late 1970’s (see graph below) – there has been a rise in oil production from non-traditional sources in North America, such as Alaska (though Alaskan production has since begun to decline), deep underwater in the Gulf of Mexico, and, more recently, in the Albertan oil/tar sands, in shale deposits in states like Texas and North Dakota, and, expected in the near future, deep underwater off the coast of Newfoundland. Talk of beginning to develop the potentially humongous Alaskan and Canadian underwater Arctic oil reserves also became common in recent years.Crude_oil_prices_since_1861

All of these newer oil sources, however, tend to be more environmentally intrusive than “conventional” onshore or shallower-water offshore production. Thus, supporters of this production (more often than not Republican, of course) have been forced to leave environmentalist ideals further and further behind. Similar trends have often been occurring on a global level as well, and not only in oil production, but in coal production too. And all of this has been occurring during a time when both annual and cumulative emissions of gasses like carbon dioxide and methane are already much higher than they were in past decades.

eia_gom_production

Canadian-Oil-Sands-Production

The graph below shows “proven” oil reserves, not current oil production. The recent spikes in Canada and Venezuela are from estimates about the proven reserves in oil/tar sands:

Oil_Reserves_Top_5_Countries

Alaska_Crude_Oil_Production

And finally, shale oil and shale gas:

z131202OGJxag01

Shale-Crude-oil-Production

6) Rising Commodity Prices 

Oil and coal prices were not the only ones to rise during the 2000s. In part because of rapid manufacturing, construction, and general economic growth in China (and other countries, to a lesser extent), there was also a rise in metal, food, fertilizer, and a number of other commodity prices (see graph below). Because bulk commodities are often highly energy-intensive to produce and to transport, and because mining and in some cases agricultural production also tend to be directly environmentally intrusive, the growth in commodity production that was brought about by rising commodity prices has been an issue of environmental significance as well.

economist_cpi

Notably, as with oil and coal, the production of agricultural and mineral commodities within North America mostly takes place within Republican states or swing states, or else in the Canadian Prairies (in politically Conservative Canadian provinces that are just across the border from Republican states in the US). States like Kansas, North Dakota, South Dakota, Arizona, Nevada, Missouri, Utah, Mississippi, Nebraska, and Idaho are significant producers of agricultural or mineral commodities, for instance, and they usually (or always) vote Republican.

Because the largest commodity reserves tend to be in the vast interior states which tend to have either fairly small or very small populations, these states also get a lot of money per capita for this commodity production, and rely on commodity production for a significant portion of their states’ economic output. And the US (and Canada) really does produce an enormous amount of these commodities; it is far and away the world’s largest food exporter, for instance, which is impressive considering that it is also the world’s third largest food consumer. So, the fact that these states have long tended to vote Republican means that rising commodity prices may have contributed to the Republican parties becoming relatively less eco-friendly compared to the Democrats.

There are only a few exceptions to this pattern. The largest of these are the neighbouring states of Wisconsin, Minnesota, and Iowa. Wisconsin produces agricultural goods like corn and dairy products and almost always votes Democrat; Minnesota produces most of the US’s iron ore (the world’s most traded commodity aside from crude oil), yet has voted Democrat in every presidential election since 1972, and in fact was the only state in the entire country to vote against a second presidential term for Republican Ronald Reagan in 1984; and Iowa – an important state in US politics, because it holds the earliest caucus during the presidential primaries – has an economy that is highly dependent on corn production, yet has shed its Republican-leaning past by voting for the Democrats in five of the last six presidential elections (in part, perhaps, because a lot of its corn is used to create ethanol, a more eco-friendly substitute for gasoline. Also Iowa produces more wind power than any state other than Texas). But even Iowa, Minnesota, and Wisconsin were all among the top ten closest races in the 2012 election among states in which the Democrats won; their populations only gave about 6.5 percent more of their votes to Obama than to Romney.

Because of rising commodity prices, commodity extraction has been an issue of growing environmental significance on a global level as well, particularly within the developing world. This too may have also led to a growing divide between Democrat voters, who arguably tend to be more global-minded in their political outlook when it comes to non-military issues, and Republican voters, who arguably tend to be more nationalist or insular in their worldview.

7) Changing Electoral Demographics 

Demographic changes as a result of immigration and internal migration have changed the US electoral map over time, aiding the Democrats and, as a result, perhaps making them less in need of reaching out to energy and commodity producing corporations in swing states, or to the very rich or super-rich throughout the country, or to the states which depend the most on energy or commodity production (many of which tend to have relatively few non-white inhabitants, incidentally). As you can see from the graph below, the US immigration boom has increased steadily in recent decades, and took off in a big way around 1990. So, immigration to the US is to a certain degree actually a fairly recent phenomenon (ignoring the pre-WW1 immigration boom, which is practically ancient history at this point). In fact, most second-generation immigrants from the heart of the most recent boom are still just turning 18 around now. And even among those who have already turned 18, voting participation tends to rise with age.

USA-Immigration-Annual1

We already discussed the flipping of California from swing state to Democrat state, which was, at least in part, the result of inward internal migration from other parts of the US and external immigration from Asia and of course from Latin America. More recently, immigration from Mexico has flipped the state of New Mexico, which voted for the Republicans in every presidential election from 1968 until 1992, but has now voted Democrat in every presidential election since (with the exception of 2004, when it voted for a second Bush term). In the 2000 election, in fact, New Mexico was surrounded by a virtual sea of red states (see map below), but still voted for the Democrats; it was the counterimage of New Hampshire in that election, which voted Republican but was utterly surrounded by blue states.

2000 US election map

Immigration from Latin America (plus internal migration of young liberals to the city of Denver) may also have led Colorado – the population of which is now 20-25 percent Hispanic – to go from voting for the Republicans in every presidential election but one from 1968 until 2008, to voting for Obama in both of his elections. A similar thing is probably true of Nevada (now 25-30 percent Hispanic, and with a huge amount of internal US migration to Nevada’s Las Vegas metropolitan area in the past decade), which has actually voted for the winning US president in every single election since after 1976 (most of which have been Republicans), and could be about to vote Democrat for the third election in a row in 2016.

Many Democrats also think it may just be on the verge of happening in Arizona as well (now 30-35 percent Hispanic, and with lots of people from across the US moving to Phoenix), which voted Republican in every single presidential election but one since 1948. In 1964, in fact, Arizona was the only Republican-voting state in the country outside of “the South” – see map below. While Arizona did not vote for Obama in either of his elections, it may be that it would have voted for Obama in 2008 had his opponent not been Arizona’s own John McCain. Arizona and Nevada both produce almost no fossil fuels.

1964_Electoral_Map

Immigration may also help the Democrats win the eastern states of North Carolina and Virginia, the 9th and 12th most populous US states, respectively, neither of which produce much fossil fuels. The populations of North Carolina and Virginia are both now around 10 percent Hispanic (in other words, far less than some states, but far more than many other states). The population of Raleigh, North Carolina has also been swelled by a very large amount of internal migration from across the country during the last decade, as has the population of the metropolitan area of the city of Washington. D.C., which extends into Virginia. In fact, the cities of Charlotte, North Carolina and Raleigh, North Carolina have had the US’s two fastest-growing Hispanic populations since 2000, and Washington D.C. was not far behind them. North Carolina had not voted Democrat since 1976 and Virginia not since 1964, but both voted for Obama in 2008 and Virginia voted for Obama in 2012 as well.

Even more importantly, many Democrats think these same trends are now working to help them secure some of the country’s largest states, most notably Florida. Florida has historically tended to vote for the Republicans more often than the Democrats, but voted for Obama twice (and may technically have voted for Gore over Bush in the contested 2000 election which saw a Florida recount, even when the governor of Florida at the time was Bush’s own brother Jeb). Florida’s population is now around 25 percent Hispanic, and in particular has seen a large amount of growth in its non-Cuban Latin American population and among younger Cuban generations. This demographic shift is probably significant, given that the original Cuban generation that has been prominent in Florida’s politics in recent decades tended to be relatively conservative politically, reflecting the fact that in many cases it was made up of middle-class and upper-class Cubans who had to leave Cuba following the Communist Castro takeover there. Florida too produces very little fossil fuels.

Illinois, which in recent decades has been a swing state that has tended to vote for the Democrats, has perhaps seen its Democratic base strengthen as well because of demographic changes. It is now more than 15 percent Hispanic. New Jersey, the 11th most populous US state, is a Democrat state that used to vote often Republican prior to Bill Clinton (and which the Republicans probably hope to retake, which may be a part of the reason why they have been considering choosing the current Republican New Jersey governor Chris Christie as their candidate in 2016), and it now has a population that is approximately 20 percent Hispanic.

Ohio, Pennsylvania, and Michigan, the three largest conventional swing states in the US apart from Florida, have also had fast-growing Hispanic populations in the past decade or so, though their overall Hispanic populations remain only about 3.5 – 7.5 percent of their total populations. (Michigan also had fast-growing immigration from Iraq during the past decade). On the other hand, these states have also seen some outward internal US migration of young voters to other states.

Finally, even Georgia, a firmly Republican state which is the 8th most populous state in the country, could perhaps soon flip to the Democrats, the result of having a fast growing Hispanic population (the 10th fastest-growing of any state since 2000, which now accounts for more than 10 percent of the state’s total population), a large, long-established African-American population (roughly 20 percent of the state’s total population), and some young, potentially liberal families moving to Atlanta (which was one of the US’s fastest-growing metropolitan regions during the 2000s). Georgia also produces very little fossil fuels.

8) External US Geopolitics   

During the Cold War, most Americans saw the Soviet Union as a very real potential threat to their security. The Soviet economy was dependent on producing energy and other commodities, which meant that any energy or commodity production within the United States would significantly hurt the Soviet position. Indeed, it was probably not a coincidence that the Soviet Union collapsed during a period of low energy prices. And it was not only the Soviets that were dependent on high commodity prices: until around the 1990s, the Communist Chinese were net exporters of energy and commodities as well.

Today the US is no longer in a Cold War. In fact, some of the nations in the world that seem potentially the most capable of challenging American power over the medium-term, such as China, Japan, Germany, or India, would all benefit from low energy and commodity prices far more than the US would — while, conversely, close US allies like Canada, Australia, Scandinavia, and even Britain are all significant energy or commodity producers, and so would actually be hurt by (or in Britain’s case, not benefit too much from) such lower prices.

As a result, the US has no real “strategic” geopolitical impetus to support rising domestic energy or commodity production in the way that it used to (though some Americans, particularly Republicans, have recently begun to support rising American oil production as a way to undermine the governments of countries like Russia and Iran). The collapse of the Communist Russian empire in 1990, therefore, combined with the transformation of Communist China from a net commodity and energy exporter to a gigantic commodity and energy importer, has perhaps been helping to cause more Americans (or at least, more Democrat politicians) to favour stronger domestic environmental protection.

9) Keystone XL and the Swinging Midwest

The defining feature of the American electoral system today is that, apart from Florida, every one of the largest US swing states are located in the Midwest (especially if you count Illinois as a swing state, as perhaps is appropriate to do). This may be a big part of the reason the incumbent Democratic party has embraced Pennsylvania’s enormous shale natural gas boom (see graph below), in spite of its potential environmental damage, partially under the guise of loving natural gas consumption as an alternative to dirtier coal consumption. (Shale gas has, for example, allowed the Midwest to retire many of its coal-fired power plants — see map below).

EIA-12-17-graph

CoalRetirementsMap

The electoral centrality of the Midwest may also be one reason the Democrats have refused to allow the Keystone XL pipeline to be constructed, because, by preventing Albertan heavy oil from reaching refineries on the US Gulf of Mexico coast by way of the Keystone pipeline, refineries in the Midwest were given a near-monopoly on Alberta’s oil exports, which really helped the refining industry (and to a lesser extent, people who drive a lot) in the Midwest. This is because the type of heavy oil produced in the Albertan tar sands deposits can only be refined at a certain refineries, of which there are very few outside of the Gulf of Mexico region or the Midwest. Indeed, after around 2009, Albertan oil in the Midwest (which tends to be measured by West Texas Intermediate or Western Canada Select prices – see graph below) began to cost significantly less than oil  in most other places in America or the world (as measured by Brent Crude prices).

Oil_Price_Gap

It might be a bit cynical or conspiratorial to suggest (though others, like the former chief economist of the major Canadian bank CIBC, Jeff Rubin, have come very close to suggesting it), but it does seem possible that the Democrats’ blocking of Keystone by invoking environmental concerns was, at least in part, a political ploy intended to help them secure their influence in the Midwestern swing state region, while at the same time having the added benefit of denying financial profits to the Republican states and businesses on the Gulf coast, depriving the Republican-friendly Albertans of an even larger amount of profits, and channelling environmentalist ire toward Albertan tar sands production instead of toward Midwestern activities supported or tolerated by the Democrats, such as shale energy production, coal production, auto-manufacturing, suburban sprawl, and certain types of environmentally-intrusive farming.

Because this dynamic only emerged in recent years, as a result of the rise of Canadian tar sands oil production and the shale oil boom in North Dakota (which had by far the largest oil production growth of any US state, and which competes with oil from neighbouring Alberta and Saskatchewan for pipelines, trains, etc.), it may have contributed to the recent rising politicization of environmental protection.

10) Midwestern De-industrialization and Southern Industrialization 

In recent decades, the US manufacturing sector has become much smaller as a percentage of US GDP, and also much less labor-intensive. According to Business Insider magazine, the United States saw its manufacturing jobs decline by 32 percent during the 2000’s. Because many manufacturing industries are energy-intensive and resource-intensive, this means that there are fewer voters who have a very direct stake in environmentally damaging work. De-industrialization has also been something of a regional affair, occurring the most within Democrat or swing states in the Midwest/Great Lakes region, such as Michigan, Ohio, and Pennsylvania. Among other things, these states produce cars and trucks (and components for cars and trucks), which, while still a very large cause of pollution in North America, have nevertheless become much more fuel-efficient than they used to be. Some Republican states in the South, in contrast, have actually been industrializing (and in particular, growing their auto-manufacuring) in recent years and decades.

The 10 Largest “Relative” Trade Networks

If you follow the financial news media, you will frequently hear of countries’ largest trade partners being either the United States, the European Union, or China. As a result, it can often seem like the US, EU, and China are at the centre of massive global networks of international trade. In a certain sense, of course, they are: the combined external merchandise trade of the US, EU, and China is equal to an estimated 11 trillion dollars a year. And yet, relative to the enormous size of their GDPs, the US, EU, and to a lesser degree China do not actually trade very much compared to most other countries.

North America and Europe are in fact relatively insular in their international commercial relations. The US and the EU, for instance, trade an amount of goods estimated at around 25 percent of their GDPs; by comparison, Germany trades an amount equal to an estimated 70 percent of its GDP, South Korea trades an amount equal to roughly 80 percent of its GDP, and the Netherlands trades an amount equal to roughly 150 percent of its GDP. Even China, which is generally viewed as a highly trade-dependent economy, trades an amount that is equal to only an estimated 45 percent of its GDP, which is lower than most of the countries in the world.

In other words, the economies of the US, EU, and China only seem so trade-oriented because their massive economic size makes them the largest trade partners of a large majority of the world’s countries.  This confusion stems from the fact that the media tends to view the size of international trade values in absolute terms only, rather than by looking at the size of those trade values relative to some other relevant factor, such as the size of the GDP’s of the countries involved in the trade. By looking only at absolute trade values, the huge economies of the US, EU, and China end up getting almost all of the public attention, even though their “relative” trade with most other countries actually tends to be relatively insignificant.

In this article, therefore, we have tried to quantify the international trade networks of the world’s major economies in relative terms; specifically, by dividing the absolute value of their trade by the size of their trade partners’ respective GDP sizes. We already did this with Ukraine and Canada in previous articles, and found some interesting results in both cases. In this article, we will try to make similar graphs for the trade networks of China, the United States, Germany, Japan, Britain, Brazil, Russia, India, Australia, and Turkey.

Before we begin, however, it is important to note that measuring trade values is not always a simple process. There are a number of reasons why the following graphs should be viewed with a grain of salt. For example, the data they were made with may be inaccurate in some cases (the absolute trade values in  data was taken from the MIT’s Observatory of Economic Complexity; the GDP data was taken from the World Bank). It also only includes trade in goods, ignoring trade in services, international investment flows, illegal smuggling, or tourism.

Arguably, the data can also be misleading in some instances, because it over-emphasizes trade hubs like Singapore, Hong Kong, Belgium, and the Netherlands (and, as a result, perhaps under-emphasizes the trade of countries that are closely commercially integrated with these trade hubs, such as Germany or China). It also treats Hong Kong as an independent economy rather than as part of China, which it probably should not do. Finally, since the Observatory of Economic Complexity only gives data for countries’ top 20 absolute trade partners, in most cases these graphs will still ignore some small countries. For example, the Bahamas probably has a huge relative trade relationship with the US, but it was still too small in absolute terms to be included.

All that being said, I think these graphs might be interesting and instructive. So, here they are:

China – Exports: $2.1 trillion, Imports:$1.4 trillion

China's Absolute Export Partners
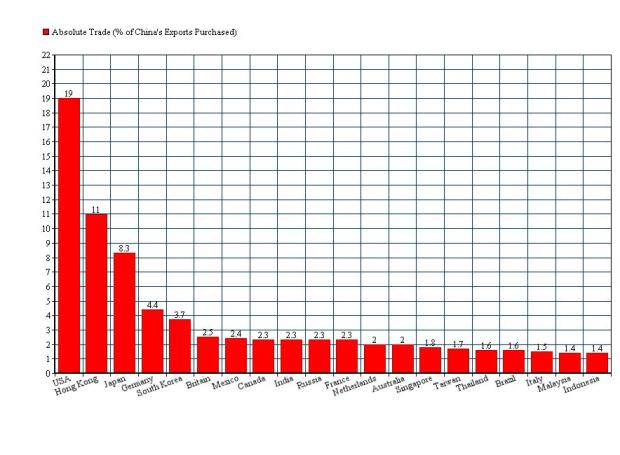
In the graph above we see China’s “absolute” export patterns – in other words, the type of trade patterns we would normally hear about in the media. The US buys an estimated 19 percent of China’s exports, Hong Kong buys an estimated 11 percent of China’s exports, Japan buys 8 percent, and so on. In the graph below, however, we see China’s “relative” export patterns, which tell a very different story:

China's relative exportsAs you can see, in relative terms (i.e. relative to GDP size), Hong Kong buys way more of China’s exports than any other economy does. (And of course, as we said earlier, Hong Kong should actually probably be considered part of China). Singapore and Malaysia, both of which are partially Chinese-inhabited, are next after Hong Kong, followed by Thailand, Taiwan, and South Korea. The US, meanwhile, which had a strong lead in China’s “absolute trade” export patterns, scores very low in this relative trade graph.

China relative and absolute importsHere we see China’s import patterns, both relative and absolute.  The US, though it supplies China with an estimated 8 percent of its overall imports, scores at the very bottom of China’s relative imports list, far behind every other country apart from France. Hong Kong again scores number one in terms of relative trade, but its dominance on relative imports is not nearly as high as it was with exports (this is because most of China’s imports from Hong Kong’s are of services, rather than goods, and the data here does not include services). Taiwan, conversely, is much higher on this imports graph than on the exports graph above. Angola, which was not even on the exports list, scores extremely high in terms of relative imports, because of the oil it supplies China with. Other resource suppliers like Chile, Saudi Arabia, Iran, and Australia also have higher scores on this relative imports list.

USA – Exports: $1.3 trillion, Imports: $1.8 trillion

us relative and absolute exportsHere we see that Mexico is higher than Canada in relative terms, even though Canada is higher in absolute terms. We see that Hong Kong is very high in relative terms, more than 7 times higher than China is (though perhaps most of the US’s exports to Hong Kong are really going to China anyway), as is Singapore. Latin American countries like Chile and Colombia score high in relative terms, as do Belgium, the Netherlands (though both may be trade hubs for US exports to other European countries), and Switzerland. US allies South Korea and Taiwan also score high in relative terms. Major economies like Britain, Germany, France, Japan, China, India, and Italy all score very low in relative terms.

us relative and absolute importsFor US imports, Mexico actually scores almost twice as high as Canada in relative terms (and this does not even include massive narcotics imports from Mexico). Ireland and Vietnam both score very high (higher even than Canada), followed by Colombia, Thailand, South Korea, Taiwan, and China. China scores much higher here than it did in terms of US exports. Nigeria also scores highly, since it sells oil to the US. For the US’s absolute imports, four countries dominate: China, Mexico, Canada, and Japan.

Germany – Exports: 1.32 trillion, Imports: $1.09 trillion

Germany relative and absolute exportsIt is interesting to note that France, which buys more of Germany’s exports than any other country does in absolute terms, scores far lower in relative terms than most of the countries in Central and Eastern Europe. Given that most Eastern European countries are still developing, the fact that their relative imports from Germany are so high could be especially significant. Also notable is how tiny the relative exports of Germany to countries like China, the US, and Japan are. Germany is in general the most export-dependent of any economy we will look at in this article.

Germany relative and absolute importsIn terms of Germany’s relative imports, the Czech Republic and Hungary are again at the top of the list, this time joined by Slovakia. Britain scores lower on this list than it did in the exports list. Norway, which sells oil and gas to Germany, scores much higher. Russia, which also sells oil and gas to Germany, does not score higher, however (though it may be that much of this oil flows through the Netherlands, and is counted as a German import from the Netherlands instead of from Russia). The US scores extremely low.

Japan – Exports: $794 billion, Imports: $793 billion

japan relative and avsolute exportsjapan relative and absolute imports

Britain – Exports: $434 billion, Imports: $615 billion

Britain relative and absolute exportsbritain relative and absolute imports

India – exports: $275 billion, imports: $ 448 billion

india relative and absolute exportsIndia relative and absolute imports

Brazil – exports $247 billion, imports $223 billion

brazil relative and absolute exportsbrazil relative and absolute imports

Russia – exports $470 billion, imports $324 billion

russia relative and absolute exportsrussia relative and absolute imports

Apart from the countries we have looked at so far, France and Italy are the two largest economies in the world in terms of nominal GDP, according to the World Bank. However, since we have already looked at two European countries (namely, Germany and Britain), I made graphs for Australia and Turkey instead. Australia and Turkey are listed as the world’s 12th and 17th largest economies in terms of nominal GDP.

Australia – exports: $249 billion, imports: $240 billion

Australia relative and absolute exports Australia relative and absolute imports

Turkey – exports: $161 billion, imports: $205 billion

Turkey relative and absolute exports Turkey relative and absolute imports

5 Challenges for Canada’s Economy in 2015

Canada, the world’s sixth largest “developed” economy, has been on an excellent run in the recent past. According to figures from the World Bank, Canada’s GDP grew at a faster pace than those of the United States or Britain during five out of six years between 2008 and 2013, and during 10 out of 15 years since 2000. It grew at a faster pace than those of Japan, Germany, and France during more than 20 out of 25 years since 1990.

In 2014, however, Canadian growth appears to have trailed that of the US and Britain, the first time since 2003 that it has lagged behind both at the same time. Now, with oil prices having fallen by more than 50 percent since just the start of October, many Canadians are worried their economy will disappoint even more during the months ahead. These fears may be justified: the Canadian economy could have to face a number of significant challenges in 2015.

Challenge #1: Oil Prices

Lower oil prices, assuming they persist, represent a fourfold threat to the Canadian economy:

1. Oil exports account for a larger share of GDP in Canada than they do in any other nation in the rich world, with the exception of Norway or the Gulf Arab monarchies. In fact, apart from Canada, Norway, or Denmark, every noteworthy developed economy in the world is actually a net importer of oil. Canada, in contrast, is the world’s 10th largest net exporter of oil, and the world’s 5th largest net exporter of oil outside of the Middle East.

As of August 2014, the value Canada’s oil exports were the equivalent of approximately 3.6 percent of Canadian GDP, which means that the 50 percent reduction in the price of North American crude oil that has occurred since August should lead, all other things being theoretically held the same, to a 1.8 percent contraction in Canadian economic output. By comparison, during the “Great Recession” of 2009, Canada’s (and the US’s) GDP shrunk by an estimated 2.7 percent, which is the only year Canada’s GDP has contracted since 1991, when it shrunk by 2.1 percent.

2. Canadian oil sands projects, which in 2013 accounted for roughly 60 percent of Canadian oil production, are on the higher end of the production cost range, with average break-even costs estimated (by some) to be around $80-85 per barrel. This, of course, is without even taking into account most of the environmental costs associated with its production, which tend to be substantially higher than those of other oil projects as well. Newfoundland, meanwhile, which accounts for around 9 percent of Canada’s oil production, also has high break-even costs, since it is primarily engaged in offshore drilling.

3. Most Canadian oil is of the heavy or extra heavy variety, and has a high sulphur content. There are currently very few refineries capable of handling this type of oil; most of the ones that are able to refine it are located either in the US Midwest or along the US Gulf coast. The rapid growth of oil production from shale deposits, however, which is ultra-light oil and “sweet” (meaning it has a low sulphur content), and which in most cases has lower production costs and does less damage to the environment than Albertan oil sands production does, is causing some of these refineries to be retrofitted to handle light, sweet oil instead, potentially leaving much of Canada’s oil output less valuable.

4. None of Canada’s most important trade partners are likely to be among the main beneficiaries of falling oil prices. Canada has one primary trade partner, which is the United States, and three secondary trade partners: China, Mexico, and Britain. The US accounts for more than half of Canadian trade, while China, Mexico, and Britain combined account for close to 20 percent of Canadian trade.

None of these four countries, however, are significant importers of oil, or of energy in general. Net energy imports account for less than 15 percent of the US’s total energy use, and net oil imports were (as of August) equal to just an estimated 1.6% of US GDP, both much lower than in most other developed economies (see graph below). In fact, if oil prices continue to fall, they might drop below the break-even prices of US shale production, Alaskan oil production, or offshore oil production in the Gulf of Mexico, which could hurt the US energy industry and grant oil market share back to the lowest-cost producers such as Saudi Arabia and the other Gulf Arab monarchies.

Developed Economies Energy and oil importsWhat is more, the US is a leading exporter of a number of commodities that may see their prices fall as a result of lower oil prices, such as coal and food. Compared to Northeast Asia or Europe, the US is also barely dependent on importing most important minerals, such as iron ore, copper, or aluminum, the prices of which often correlate with oil prices as well to a certain extent. The US is a net exporter of iron ore, in fact, which has the largest international market of any commodity apart from crude oil, and which has seen prices fall by around 30 percent in the past six months and 50 percent in the past year. (Canada, meanwhile, is the world’s fourth largest net exporter of iron ore). The United States’ wealth of natural resources could prevent it from benefiting too much from falling oil prices.

While China, Canada’s second largest trade partner, has become the world’s largest oil importer, it is actually not too dependent on its oil imports either (see graph), since it produces so much coal domestically, and coal continues to account for over two-thirds of its overall energy consumption. China is actually the world’s fourth largest oil producer, sixth largest natural gas producer, fifth largest nuclear power producer, and largest producer of hydroelectricity, wind power, and energy from biomass. Energy imports account for only around 10-15 percent of China’s total energy usage, which is many times less than in most other economies in Asia, or than most countries in the developed world.

20150123103628Britain and Mexico are not significant net importers of oil either. Britain, unlike other large European economies, is only a very minor importer of oil (it is actually one of the world’s top 20 oil producers, because of the North Sea), while Mexico is the world’s 15th largest net exporter of oil and, despite importing more natural gas from the United States than it ever has in the past, also remains a net exporter of energy in general.

Thus, Canada’s main trade partners are not likely to be among the leading beneficiaries of falling oil prices – at least, not unless their populations respond to cheaper gasoline prices by going out and spending far more money than they otherwise would have. As a result, Canada should not necessarily expect these trade partners to boost their purchases of its exports during the months ahead.

[Note: Japan’s trade with Canada may actually be a little bit larger than Britain’s or Mexico’s. However, this is only because the Japanese economy is much larger than Britain’s or (especially) Mexico’s. Per dollar of its GDP, Japan buys significantly less from Canada than Britain, Mexico, or the US do relative to the size of their own economies (see graph below). This means that British, Mexican, or American economic growth might be more likely to have a stimulative effect on the Canadian economy than the same amount of Japanese economic growth would. Similarly, Mexican growth would probably help Canada more than growth in any country apart from the US would, so it is a shame for Canada that Mexico is a net exporter of both energy in general and oil in particular]Canadaian exports
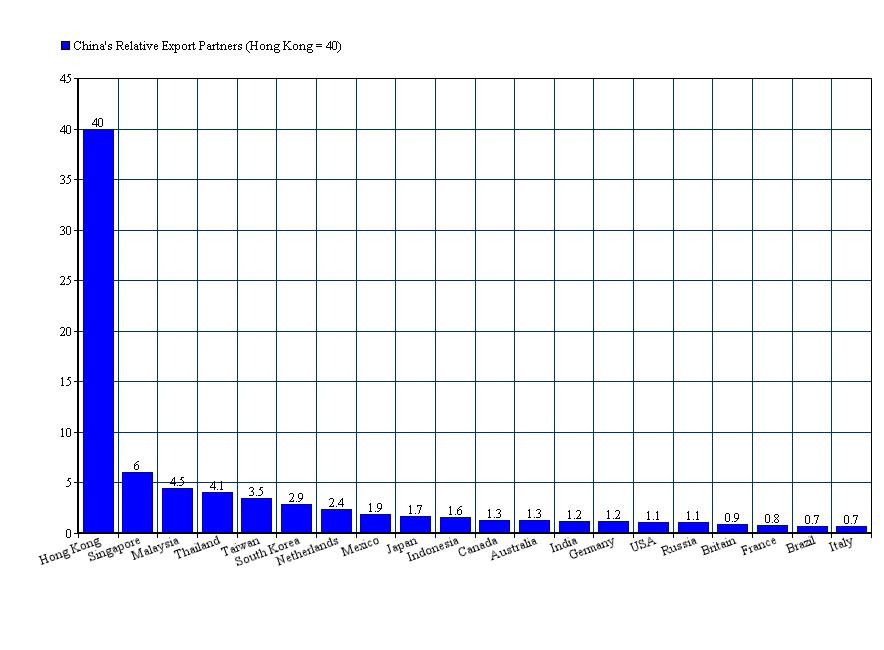
Challenge #2: Other Commodities 

The price of oil is often correlated with the price of commodities in general, since bulk commodities tend to require a lot of energy to produce and a lot of fuel to transport. This presents an additional risk for Canada, given that Canada is not only a massive exporter of oil, but also of many other commodities. Commodities other than oil account for an estimated 20-30 percent of all Canadian exports. Most of Canada’s most important non-oil commodities have prices that tend to correlate at least somewhat with oil prices. These include not only natural gas and coal, but also industrially used metals like nickel, copper, and iron ore, as well as nonmetal commodities like potash (used for fertilizer) and timber (which in Europe accounts for half of all energy produced from “renewables”), both of which Canada is the world’s largest exporter of. Canada is also the world’s third largest net exporter of electricity, trailing only France and Paraguay, and the world’s largest uranium producer apart from Kazakhstan.

Canadian natural gas, which is by far the most valuable Canadian commodity export apart from oil, has recently been fetching prices far below the global average, since natural gas is costly to ship overseas, and since the US market is already over-supplied because gas is coming up as a by-product in shale oil production. Coal prices, meanwhile, have been hurt by a combination of falling oil and gas prices, slowing Chinese industrial growth, and concerns over pollution in various countries (China included). While coal in Canada receives little media attention because of the prominence of Canadian oil and gas, it nevertheless remains one of Canada’s top four or five commodity exports.

Canada is also the world’s second or third largest exporter of wheat, trailing only the US and maybe France. Canadian grain production tends to have relatively high break-even prices, a result not only of the latitude and climate of farmland in the Prairies, but also of the fact that the Prairies are landlocked and have no access to commercially navigable waterways (unlike US, European, or Argentinian farmland, for example), which are necessary to reduce costs given that grains are bulky goods which even today are expensive to transport long distances overland. In Canada, therefore, export revenues might be hurt more by falling grain prices than they would in other significant grain-exporting countries. The Food and Agricultural Organization of the United Nations estimates that in 2014 global food prices fell by 3.7 percent, the biggest fall since 2011, led by grain prices which fell by around 12.5 percent, with nearly all of that fall occurring during the past six months.

Finally, there is marijuana, which, though it is difficult to be certain, arguably accounts for more of Canadian export revenues than any commodity apart from oil or natural gas. Indoor marijuana production, which is responsible for a large share of Canadian production, is an extraordinarily energy-intensive enterprise, such that falling energy prices may cause Canadian producers to save on input costs. On the other hand, there is the legalization of marijuana in Washington state, which is just across the border from marijuana-growing British Columbia, as well as in states like Colorado and, most importantly, California. Legal marijuana production in the US has taken off in the past year or so, and it will probably squeeze the value of Canadian (and Mexican) marijuana exports.

Challenge #3: China 

The relationship between Canada and China is based around more than just exports of Canadian natural resources to China and imports of Chinese manufactured goods to Canada. British Colombia  in particular has a close economic relationship with China, the result of Vancouver’s (and Victoria’s) Pacific coastline and physical isolation from most of the rest of the Canadian and North American markets. British Colombia sends approximately 35 percent of its overseas exports to China, which is almost twice the share that the rest of Canada does, and 2.5 times the share that the United States does.

Partly as a result of this British Columbian transpacific relationship, Canadian exports to China are equal to roughly 2.5 percent of Canada’s GDP, whereas US exports to China are equal to only 1.3 of the US’s GDP. In addition, there are social and financial ties between Canada and China that are economically significant, albeit difficult to measure precisely, reflecting the fact that roughly 11 percent of British Columbia’s population and 5 percent of Canada’s total population are of Chinese origin — compared to just 1.2 percent for the US’s population, 0.3 percent for the European Union’s population, and 4 percent for Australia’s population.

All of this is to say that Canada will feel the effects of an economic slowdown in China, and not only because of the effect such a slowdown would have (and has already been having) on commodity prices. Canada could be particularly affected by a crisis in southeastern China, if one were to occur, since because of the historical connection between Canada and Britain, most of the Chinese immigrants in Canada have come from Hong Kong and adjacent parts of southeastern China (and spoke southeastern Chinese languages like Cantonese, even though Cantonese is only spoken by approximately 60 million people within China, compared to nearly a billion Mandarin speakers).

Notably, eastern Chinese provinces have had the slowest growth in China every single year since the global financial crisis. Meanwhile, Hong Kong’s economy has slowed immensely in recent years and had an especially difficult 2014, and mainland southeastern China was the slowest-growing major Chinese region in 2014. This could potentially wind up being bad news for the Canadian economy this year.

Challenge #4: The United States   

According to most Canadian economic analysts, Canada’s saving grace in 2015 is likely to be the US economy, which has been rebounding to a certain extent from its relatively poor performances in 2007, 2008, 2009, 2011, and 2013, and which had particularly strong growth in the third quarter of 2014. While this assessment is probably true, it is nevertheless important to point out that the American economic recovery has not been occurring in the areas of the US that have the greatest impact on the Canadian economy.

Most of Canada’s exports to the US go to states in the Northeast or Midwest, on the borders of the Atlantic or, especially, the Great Lakes. Michigan, New York, Ohio and Illinois together receive around one-third of all Canadian manufacturing exports to the US, for example. Yet most states in this region have not performed very well during the years since the financial crisis.

With the exception of states like North Dakota, which have economies based around the production of commodities like oil and agriculture and compete directly in these industries with neighbouring Canadian provinces in the Prairies, most of the best-performing US states have not been near the Canadian border. Instead, they have been in southern or western states, most notably Texas. Ohio, Michigan, and Illinois, meanwhile, were among the slower-growing economies during that same period. These trends have largely continued during 2013 and 2014 (though, on a more positive note for Canada, the economy of Michigan has been doing decently in the past two years, and Michigan is the single largest importer of manufactured goods produced in Canada).

In addition, upstate New York, the only part of the US which borders both Ontario and Quebec, has performed far worse than the New York City metropolitan area through these years. In Michigan, similarly, growth has been stronger in the western part of the state, which does not border Canada, than in the northern or eastern parts of the state, which do. And in Ohio, growth has been stronger in southern cities like Columbus or Cincinnati, which are relatively far away from Canada and the Great Lakes, than it has been in northern, Lake Eerie cities like Cleveland or Toledo.

Falling Energy Prices and US State Economies

In spite of auto-related manufacturing in states like Michigan and Ohio, the US’s Northeastern and Great Lakes states will not necessarily be among the main beneficiaries of the fall in energy prices. New York, for example, consumes the least amount of energy per capita of any state apart from Rhode Island. Northeastern states like Vermont, New Hampshire, and Massachusetts, which have close ties with Canada, are extremely energy-efficient. The Pacific northwestern states, Oregon and Washington state, which are economically integrated with British Columbia, are also energy-efficient. And the Great Lakes are for the most part only partially energy-intensive economies (apart from Indiana, which is quite energy-intensive). Michigan consumes the 16th least amount of energy per capita, while Pennsylvania is 20th, Illinois is 25th, and Ohio is 28th.

Moreover, the area in and around the Great Lake states is one of the major energy-producing regions of North America, and therefore may not benefit as much from cheaper energy as some other parts of the US will. Pennsylvania produces significantly more energy than any state aside from Texas or Wyoming, and much more natural gas than any state other than Texas. The West Virginia-Pennsylavania-Kentucky-Illinois-Indiana-Ohio region accounts for around three-quarters of all the coal production in the US outside of Wyoming; coal production which is being squeezed by falling natural gas prices as a result of fracking.Ohio, Illinois, and to a lesser extent Michigan also produce a decent amount of oil themselves, and Michigan has the largest natural gas storage capacity of any state in the country.

Meanwhile, the shale gas basins in this region, namely the Marcellus basin and the (more geologically challenging and expensive to develop) Utica basin, have had by far the fastest productivity growth in recent years of any major basins in the United States (see graph below). In the case of the Utica, which contains significant amounts of both oil and natural gas, the basin encompasses not only Pennsylvania, as the Marcellus does, but also other areas near Canada, like eastern Ohio and upstate New York.

utica gas

us_shale_map

In spite of their historical reputation for loving and making cars, none of the Midwestern states even remain among the top ten states in terms of per capita vehicle ownership. Even Michigan now only ranks around 15th in terms of per capita vehicle ownership. The Great Lakes/Midwest is also one of the leading ethanol-producing, iron-ore producing, and food-exporting regions in the entire world, which could hurt as food, fuel, and mineral prices have been falling.  Finally, cheaper oil could make it cheaper for people living in northern cities like Buffalo to fly south or west, spending more time and money in sunnier states, or in the Rocky Mountains.

It may also be worth mentioning that, even as American growth is generally a good thing for the Canadian economy, the fact that the US is growing at a decent pace at a time when countries like Russia, Japan, Germany, Brazil, and possibly even China and Mexico are all flirting with recession means that US national power might increase at a pace that could become uncomfortable for some of the economies that have to deal with the Americans most often, potentially including Canada.

Indeed, given that US election season is approaching, American politics could perhaps become relatively erratic during 2015. The Republican-controlled Congress, the Democratic-controlled White House, or various US state governments could, for instance, place indirect restrictions on imports from various provinces or industries within Canada in order to provide a short-term protectionist boost to American employment growth. They might also run political attacks against the Albertan oil sands during the year leading up to the election: the Democrats in order to energize their environmentalist base; the Republicans (and in some cases the Democrats) in order to divert environmentalist ire away from American coal production, offshore oil production, or fracking.

Challenge #5: Canadian Politics

There is a federal election in Canada in 2015. In most countries, investors usually have a clear idea of what they want to see from an election. They want the victory of a competent, “market-friendly” candidate, with a majority government and no significant regional divisions displayed in the country’s voting patterns. This is, in fact, what they got out of the most recent Canadian federal election, in 2011: the right-of-centre Conservative Party won a decent-sized majority government (which was Canada’s first majority government since prior to 2004), winning in Ontario, British Colombia, and the Prairies, while at the same time Quebec abandoned its independence-minded Bloc Quebecois en masse in favour of the NDP, which also became the largest opposition party by a large margin in Ontario, British Colombia, and the country as a whole.

From the perspective of investors, it is unlikely that the 2015 election will be much more favourable than the current situation that exists in Canada. Even if the Conservatives were to win an even larger majority than they have now, which seems unlikely, this would still only be a continuation of the status quo, and would therefore be unlikely to generate any excitement among Canadians or foreign investors. Plus, given that the Conservative leader Stephen Harper has been Prime Minister for just short of ten years now, this status quo may start to become tiring even for investors and Conservatives. It would certainly not induce any sort of “hope and change” optimism that could potentially help stimulate markets in the short-term. In fact, Harper’s opponents will likely be spending the election campaign trying to convince Canadians that their economy has been brought to the brink of recession.

In contrast, it is not very difficult to imagine that the elections could make Canada less appealing to investors. Here’s one scenario that would be much worse from an investor’s view: the Liberal Party, led by 43-year old Justin Trudeau (the son of a former Canadian Prime Minister) wins a minority government in parliament, while, on a provincial level, the country is regionally divided in its voting patterns, with Ontario going primarily for the Liberals, Quebec voting primarily for the NDP, the Prairie provinces voting primarily for the Conservatives, and British Columbia roughly splitting its vote between the Liberals and the Conservatives.

In such a scenario, Canada would have changed from having a “market-friendly” majority government led by an experienced Prime Minister, and having no regionalist tendencies reflected in its voting patterns, to having a left-leaning minority coalition government led by an inexperienced Prime Minister and having significant regionalist divisions between eastern Canada and western Canada, as well as between Quebec and the rest of the country, reflected in its voting patterns.

If the NDP defeat the Conservatives instead of the Liberals, meanwhile, which is also possible (the NDP are currently the second largest Canadian party in parliament by far), it would bring to power a party that has never been in power before in its history, which until relatively recently was viewed by many conservatives as being “far left”, and which has a leader who is only in charge because of the tragic death of the former leader of the NDP following the party’s unprecedented success in the Canadian election of 2011. (Though notably, he is more experienced than the Liberal party leader).

Even worse, a staunchly provincialist party like the Bloc Quebecois, which is currently polling at around 10-20 percent in Quebec, could theoretically end up becoming the kingmaker in a split between the Conservatives and a Liberal-NDP coalition. Investors could turn on Canada to a certain degree if they begin to think that an increasingly fragmented result such as this is likely to occur. Thus, while the defeat of Stephen Harper’s Conservative Party or the loss of its majority position in parliament would not necessarily be bad for Canada over the longer term, it arguably represents a short-term challenge for the Canadian economy – and in particular, for Canadian financial markets – during the election year ahead.

The Physics of Japanese Economics

With the downward revision of Japan’s GDP growth figures last month, the Japanese economy is technically back in recession, projected to shrink by a slight amount during the year as a whole. Even though most analysts had previously forecast Japan’s economy to expand at a rate of 2 percent in 2014, nobody was too surprised by the news that is contracting instead. The recession is the country’s fifth since 1997, and its third since the global credit crisis of 2008. While some might see a silver lining in this – namely, that Japan’s economic growth going forward could not possibly get any slower than it has already been – many economists do in fact view the country’s problems as likely to grow more rather than less acute during the years ahead.

Unlike in recent decades, Japan must now grapple with an empowered China, with slowing economic growth among key trading partners like South Korea, Taiwan, coastal Chinese provinces, and Europe, with net government debt that has risen from 80 to 145 percent of GDP over the past decade, and with a Baby Boom generation that has reached between 65 and 70 years old on average (about a decade older than those of Europe or America). These trends arguably provide the backdrop to Japan’s current slowdown, even as the catalyst for the recession has been viewed as a rise in the country’s consumption tax, from five percent to eight percent, which came into effect earlier in the year.

What might be more surprising than the recession itself is that investors in Japan’s stock market seem basically unperturbed by the news of it. The Nikkei 225 index is actually higher now than it was before the recession become public knowledge; it continues to trade at around a seven-year high, virtually double the price it averaged between 2008 and 2013. Admittedly, this is a far cry from the Nikkei’s all-time highs in 1992, when it was worth well over double what it is today. In fact it does not even match the highs of 2000, 1997, 1994, and several other years going back all the way, astoundingly, to 1986. That’s right: Japanese stocks were worth more 29 years ago than they are today. Still, a seven-year high amidst the onset of an economic recession is something that is difficult to ignore.

Of course, the rise in the Nikkei may simply reflect the fact that investors have become so accustomed to seeing Japan’s economy shrink that they built in the risk of a recession to the price of Japanese stocks ahead of time, which meant that those prices did not require much revising when the recession actually arrived. The Nikkei’s rise may also reflect the fact that investors have faith in prime minister Shinzo Abe, who has loudly promised to stimulate the Japanese economy and revive Japanese prestige, and who is already using the recession as an excuse to call a snap election intended to extend his party’s leadership by an additional two years, from 2016 (when parliamentary elections would have otherwise been held) to 2018. [update: the elections have now happened. Abe’s party won a two-thirds majority, though with the lowest voter turnout since WW2].

Or it may be that investors have so little faith in Europe, China, and commodity-exporting economies like Brazil or Australia, and see US equities as being too expensive now that the S&P 500 has again reached all-time highs in recent days, that they have been forced into Japan’s stock market almost by default. Finally, and most intriguingly, the Nikkei’s performance may reflect the possibility that the potential of Japan to achieve a renewed, meaningful pace of economic growth is actually more promising than most Japanese themselves recognize.

With Japan’s stock market and GDP indicators pointing, almost paradoxically, in far-opposing directions, Japan’s economy now resembles Schrodinger’s infamous Cat: its true health is in a state of uncertainty, the resolution of which seems to depend on the specific approach at which it is observed. Of course, unlike the Cat itself, Japan’s economy is a paradox that we know can probably be resolved. All we need to do is take a look underneath the lid, so to speak, at the underlying fundamentals of the country’s medium-term (say, within the next decade or two) economic prospects. What are those underlying fundamentals? It turns out that the originator of the Cat query, Albert Einstein, might be of some use here as well:

General Economic Relativity 

One of the most fundamental theories of conventional economic forecasting is the idea that, in general, countries that are relatively poor will grow at a faster pace than those that are relatively rich. This is, of course, why a country like India disappointed investors when it grew at 6.5% in 2011 and 5% in 2013, whereas even 2% growth in the European Union or 3% growth in the United States would be a widely celebrated event.

In the case of Japan, the extremely high income levels the country had two decades ago might have limited its economy’s ability to grow. According to the IMF, in 1995 Japan’s per capita income was 1.5 times higher than that of the next wealthiest large developed economy (the United States), 2 times higher than that of the next wealthiest large economy in the western Pacific (Australia), and 3.3 times higher than that of the next wealthiest economy in Northeast Asia (Taiwan). As a result of being so wealthly at the time, Japan’s room to expand its economy further may have been somewhat constrained.

Today could scarcely be any more different. If the idea that relatively poor countries are in general likely to grow relatively quickly (i.e., the theory of general economic relativity) is to be believed, Japan is now in a much more favourable position where its growth potential is concerned. The country has become much poorer than other developed economies in terms of its per capita income, especially in comparison to regional counterparts like Australia, New Zealand, and Singapore, which have grown rapidly since the mid-1990’s. Japan’s lead over developing East Asian economies is also not nearly as large as it used to be (see charts below), as a result of the emergence of China and the strong rebound of other East Asian economies following their financial crises in 1997 and 2008. Arguably, this comparatively low level of nominal wealth bodes well for the Japanese economy going forward, relative to how it has performed during the past two decades.

20150123080225

20150125095027

Special Economic Relativity 

Another fundamental principle of economics is that of “comparative advantage”, the idea that economies will tend to construct themselves in ways that reflect their greatest advantages (or smallest disadvantages) in relation to other economies. This begs the question: what makes Japan special, relative to other countries? More to the point: is what makes Japan special likely to help its economy grow at a decent pace during the years ahead?

One of the main qualities that makes Japan special is its “economic mass”. This does not only refer to its economic size — Japan’s economy is the third largest in the world, 1.7 times larger than fourth-place Germany and just 1.6 times smaller than second-place China, according to the World Bank — but, just as important, refers also to Japan’s internal unity and compactness. Unlike in other major economies like the US or China, Japan’s population is not spread out over a vast territory, but is instead crammed into an area that is only about the size of Montana. Japan’s economic activity is even more highly concentrated: the Greater Tokyo Area alone accounts for an estimated 40 percent of Japanese GDP, and the island of Honshu (in which Tokyo is located) for upwards of 80 percent of Japanese GDP.

Japan is also socially cohesive. Its income inequality is relatively low (unlike the US, China, or Brazil, where income inequality is extremely high), and its unemployment rate is the lowest of any developed nation apart from Switzerland. Japan also possesses no major ethnic, linguistic, or religious divisions. An estimated 98 percent of Japan’s population is ethn0-linguistically Japanese, and, religiously, less than 2 percent is Christian. By comparison, Japan’s neighbour China is home to an estimated 23 million Muslims (mainly living in the country’s northwest), more than 100 million non-Muslim ethnic minorities (mainly in the southwest), 250-300 million native speakers of a variety of non-Mandarin Chinese languages (mainly in the southeast), and perhaps as many as 100 million evangelical Protestants.

Even Japan’s developed-economy competitors cannot compare to it in terms of internal unity. In the German economies, there has been a slowly (re)emerging commercial divide between eastern Germany, Austria, and Bavaria on the one hand and western Germany on the other, reflecting the fact that Eastern Europe has been growing quickly while Western Europe has been lodged in a seven-year economic funk. Within both France and Italy, meanwhile, northern regions have been growing while southern regions have been virtually in depression. And in Britain and Spain, secessionist movements like those of the Scots and Catalans have been growing in prominence of late.

Even in the United States there has been a growing divide between the Northeast and the South/West, a result of the fact that Texas alone has accounted for more than one-fifth of US economic growth since 2007, and that globalization and demographic shifts have had the effect of integrating states like Texas, California, and Florida more closely with Latin America than ever before, and states like California, Oregon, and Washington more closely to the rest of the Pacific world than ever before. (In Canada a similar trend has been occurring). All of these developed countries remain internally cohesive, of course; just not as potentially cohesive as Japan. Indeed, many of the above trends may be likely to continue in in the years ahead, which could make Japan’s internal unity even more distinctive.

Japan’s unique combination of economic size and internal unity may become increasingly significant during the years ahead, as it may allow the Japanese to throw their weight around in a world economy that, cliches of globalization notwithstanding, is in many ways still becoming rapidly smaller and smaller. The continuation of the Internet Revolution will probably be the most significant near-term driver of such globalization, but further leaps in conventional transport — by air, sea, or land — cannot be ruled out either. If rapid globalization does continue, and if large, internally cohesive economies like Japan are among its beneficiaries, economics may increasingly resemble Einstein’s actual theory of special relativity, with an economy’s mass beginning to directly correlate with its economic momentum.

Commercial Entanglement

Another characteristic that makes Japan special is its relative level of isolation from the rest of the global economy. According to the World Bank, the value of Japan’s international trade of goods and services is equal to just 30 percent of its GDP, a lower share than any other large developed economy apart from the US, and much lower than Japan’s most notable neighbours, China (50%), South Korea (103%), and Australia (41%). Indeed, many East Asian economies, such as Thailand, Vietnam, Malaysia, and Singapore, are among the most trade-dependent economies in the entire world. Japan, by comparison, is not only not dependent on trade in general, but is also not dependent on either imports or exports in particular.

What this means is that Japan might be able to manage a regional or global economic slowdown more easily than most other economies can. During the past few decades this ability has not mattered much, since global growth, and particularly East Asian growth, has been so formidable. Going forward, however, Japan may find itself able to manage persistently slower growth in places like China and Europe more easily than most other countries around the world will be able to.

A slowdown in China, for instance, would hurt Japanese neighbours like South Korea, Taiwan, and Australia, countries in which 30-40 percent of exports go to China and exports in general are equal to 20-60 percent of GDP, far more than it would hurt Japan, which sends just 23 percent of its exports to China (including Hong Kong) and where exports in general are equal to just 15 percent of GDP. This ability to withstand external sluggishness could be a major advantage for Japan. It has certainly been helpful for the US, where a low dependence on exports is currently shielding the American economy from simultaneous recessions in most of Europe and Japan.

Crucially, even as Japan’s trade patterns might shield its economy from the full brunt of external crises, Japan also has the potential to benefit from becoming a more vigorous trading nation in the future. In the past, Japan’s ability to access global markets has been limited by its lack of proximity to the Atlantic world, where most of the globe’s economic and consumer activity is located. As a result, Japan is likely to benefit from the expansion of the Panama Canal, which is finally set to be completed in 2016, with significant consequences for inter-oceanic shipping. (In fact, arguably the most important consequence of the canal expansion is that it will allow 80% of LNG tankers to use it — currently none do — which will benefit Japan specifically, since Japan accounts for nearly 40% of the world’s LNG imports, and since, on the opposite side of the canal, Texas, Lousisiana, and Latin America may account for much of the world’s LNG export growth in the years ahead). Similarly, Japan could benefit from the continued growth of the East Asian and Indian consumer markets, as well as from more efficient cargo shipping worldwide, by air or by sea.

Finally, Japan might benefit from being able to use the Trans-Siberian railway to directly access European markets. This may finally occur because: a) the Russians increasingly need Japan as an ally because of their growing concerns with both China and the West; b) Russia’s rail network is becoming less crowded as a result of falling commodity prices and falling European demand for coal (since coal accounts for one-third of Russian rail freight, and commodities in general account for two-thirds of Russian rail freight); and c) because technology may make it cheaper and faster to maintain and operate railways and to load and unload cargo containers, which on the Japan-Russia-Europe route you expensively have to do twice: once at the seaports on Russia’s Pacific coast, and a second time in Eastern Europe because Russia’s and Europe’s rail networks use different gauges.

In addition to its foreign trade, Japan’s global investment position looks to be relatively strong. Japan has the highest NIIP in the world (NIIP = Net International Investment Position; basically, this is the amount of money a country’s government, businesses, and people are owed after you take into account the amount of money they owe to other countries). Though trustworthy, up-to-date NIIP statistics are notoriously difficult to come by (which is why people often focus instead on public and private debt-to-GDP ratios, which can be misleading because they only take into account a country’s foreign liabilities, while ignoring its foreign assets), as recently as 2010 Japan’s NIIP was estimated to be the same as those of China and Germany – which are the world’s next two largest creditor economies – combined. Indeed, while in America the media tends to obsess over Chinese ownership of US government debt, Japan owns just 3 percent of US debt less than mainland China does, and only 13 percent less than mainland China plus Hong Kong. Japan may have lots of assets with which it can potentially revive itself, in other words.

Energy Matters 

Does the inertia of a body depend upon its energy content? In economics, the answer to this famous question of Einstein’s appears to be yes. Developed countries in which energy imports account for a high share of GDP, such as Japan, Spain, Italy, Greece, and Portugal, have suffered some of the worst growth rates in recent years, when oil and gas prices have been very high. Developed economies that are major energy exporters, on the other hand, like Canada, Australia, and Norway, or that are relatively energy neutral, like the US, Sweden, or Denmark, have generally performed much better.

Developed Economies Energy and oil imports

With oil prices having reached a five-year low, falling by well over 50 percent since just the beginning of October, countries like Japan may now be better positioned for success than they have generally been in the recent years. In fact, it is not only lower energy prices that will have a positive impact on the Japanese economy, but lower prices for other commodities as well, which to varying extents are often correlated with energy prices. Japan, to be sure, is the world’s largest importer of tin, the second largest importer of iron ore, aluminum, copper, nickel, and silver, the largest food importer among developed economies, and by far the largest spender on coffee imports apart from the US.

Of course, a developed, energy-efficient economy like Japan is not going to benefit nearly as much from falling energy prices as an energy-intensive, import-dependent emerging market like India, Pakistan, Thailand, the Philippines, or, on the wealthier side of the emerging market spectrum, South Korea or Taiwan (see graph). Even China, which only imports an estimated 13 percent of its energy (compared to 94 percent for Japan), will probably benefit much more from falling energy prices than Japan will, since the Chinese use about 5 times as much energy per dollar of GDP than the Japanese, are enormously dependent on importing commodities in general, and may be able to reduce some of their domestic pollution by replacing coal production with oil and gas imports.

20150123103628

But in this way too Japan stands to gain, relative to most other developed economies. This is because most of the main buyers of Japanese exports are energy-intensive emerging Asian economies, many of which are among the greatest beneficiaries of falling energy prices. Indeed, more than 40 percent of Japanese exports go just to China, South Korea, Thailand, or Taiwan, whereas no energy-exporting country receives more than 2.5 percent of Japan’s exports. In contrast, the US sends 25 percent of its exports to Mexico or Canada, both of which are substantial oil exporters. The Europeans, meanwhile, trade mainly among themselves, and include enormous energy exporters like Norway and Russia.

Japan is also in a unique position where alternative energy sources are concerned. It has far and away the most nuclear energy potential in the world, since it has the world’s third highest nuclear energy-generating capacity (virtually double that of fourth-place Russia), but has not been running any of its nuclear plants since the Fukushima incident in 2011 soured public support for them. Japan could, and might, turn many of them back on in a fairly short period of time.

Japan also has the fourth highest hydroelectric energy generation among developed countries (double that of fifth-place Spain), the third highest biomass/waste energy generation among developed countries (more than 50% higher than fourth-place Britain), the third highest geothermal energy production among developed countries, and the third highest solar energy generation of any country in the world (50% higher than fourth-place US). In addition, because of the growing possibility of using industrial machines to run manufacturing plants overnight, Japan may no longer be forced to waste much of the energy produced by hydroelectric, nuclear, geothermal, and wind, which unlike oil or gas cannot be shut off at night.

Finally, Japan may be able to get more commodities from Pacific Russia. First, as mentioned above, Russia is increasingly in need of allies outside of China or the West, and Japan is the obvious choice in this regard (South Korea is also an obvious choice, but South Korea is very closely embedded into the economies of both China and the West, and it is also much smaller than Japan). Second, as technology may continue to make resource-extraction much less dependent on labour, the commodity-producing potential of the Russian Far East could perhaps finally be realized in spite of the region’s tiny population of just around five million (less than one million of whom live in the gigantic territory to the north and east of Lake Baykal). Sakhalin island and the Kamchatka peninsula, both of which are relatively inhabited, rich in natural resources, and particularly accessible to Japanese influence, could be two interesting places to watch in this regard.

Russland_Relief

Demographic Entropy

Analysts who are bearish on Japan ultimately tend to focus on one factor above all others: Japan’s aging population. This is certainly not an unreasonable concern; Japan’s population is the oldest in the entire world, with a large Baby Boom generation that is on the cusp of old age, a large Echo Boom population that is on the cusp of middle age, and a population of seniors (above 65 years old) that accounts for 26 percent of Japan’s total population, compared to only 14 percent in the US, 17-18 percent in Britain, France, and Spain, and 20 percent in Germany. This is, really, the main reason the Nikkei 225 index has been trading at prices that are just 13.9 times its earnings and just 1.3 times its “book value”, compared to a 19 price-to-earnings ratio and 2.8 price-to-book ratio for the S&P 500 in the US, or 15-19 price-to-earnings ratios and 1.8-2.1 price-to-book ratios in France, Britain, and Germany, where populations are more youthful.

While it would be unwise to ignore Japanese demographics, or try to spin them somehow as being an economic advantage rather than a disadvantage, it may nevertheless be useful to play devil’s advocate here for a bit, and explore the possible reasons why Japan’s aging population may not end up being even close to as bad for its economy as it is generally expected to be.

Reason 1: Japan’s retiring population means that it alone among countries in the developed world may not be negatively affect by the one-two punch of outsourcing and automation, which could rapidly lead to unemployment and income inequality crises in other countries. This could further increase Japan’s internal unity compared to other nations, giving it even more of an edge in terms of its economic “mass”.

Reason 2: Japan’s economy is not a closed system: it can decrease its demographic entropy by way of immigration. While it has become common for journalists to point out the fact that Japanese culture is not accustomed to dealing with immigration, the truth is that Japan has historically been able to adapt its mode of behaviour in very short periods of time, so it would not really be such a surprise if the Japanese were to begin bringing in lots of immigrants in the future, breaking with tradition. Certainly Japan’s high standard of living and proximity to Asia means that it can probably attract immigrants if it wants to. Japan has not needed immigrants in the past, but if and when it does, it may turn out that it doesn’t have such an affliction to them after all.

In fact, one way of looking at the fact that foreign-born individuals only account for an estimated 1.9 percent of Japan’s population (compared to 12 percent for Germany, France, and Britain, 14 percent for the US, 21 percent for Canada, and 28 percent for Australia) is that Japan still has a lot of room to increase the share of its total population that immigrants account for. Japan could actually bring in millions of immigrants and still have them account, for example, for less than one-fifth of its population, whereas a country like Germany or even the US would perhaps start feeling uncomfortable with immigration if immigrants were to make up more than a quarter or a half of their total populations.

Reason 3: Another way to look at Japan’s population of seniors is as the first wave in an enormous global demographic shift, with the aging populations of the developed world (particularly Europe and Canada) and the former Soviet Union only about a decade behind the Japanese, and with China not too far behind them. What this means is that many of the age-related issues that Japanese populations have already been dealing with for a while may now be coming to much of the rest of the world. This might actually help the Japanese economy, if it finds some of the goods and services it has been focusing on — among them robotics, health care, pharmaceuticals, and age-related consumer products — in demand from other countries.

In other words, Japan may be able to export some of its expertise and products to aging Western, Russian, Korean, and Chinese populations who are dealing with their own increases in age-related illnesses. In fact, because of the pollution in China, the coming decade may see an enormous increase in certain types of environment-related illnesses in China, even though China’s population is still somewhat younger than most Western populations. Many wealthier Chinese may even go to Japan to receive health care. The aging of China and the West is obviously not the happiest of prospects to contemplate, but it may nevertheless be something the Japanese economy is relatively well-positioned to benefit from.

Reason 4: Even if Japan’s aging population is a long-term problem, it may not be such a burden for its economy during the next decade or so. Japan’s Boomer population is only around 65-70 today, and is still extraordinarily healthy for its age. Because of the Internet, Japanese seniors  may also be able to keep their productivity and consumption up more than people of the same age have historically been able to do. Japan’s Echo Boomers, meanwhile, are still just around 40-45 years old. Because Japanese have so few children (13 percent of Japan’s population is below the age of 15, compared to 19 percent for the US, Britain, France, and Australia), they have more time and money to spend on other things, whether work-related or leisure, which can be economically stimulative. Spending time and money on children may be great for an economy over the long term, but in the short term it can arguably hold an economy back.

Alternate Dimensions 

Economists have historically tended to view wealth as being derived from a combination of three “inputs”: capital, labour, and land. Japan is very well endowed in the capital and labour departments, but it has been held back to a certain extent by its scarcity of land. Excluding mountainous regions, which constitute an estimated 75 percent of Japanese territory, Japan is only about the size of Michigan. Even including its mountains, Japan’s population density is 1.5 times higher than Germany’s and ten times higher than in the US. Among significant economies, only India, South Korea, and the Netherlands are more densely populated than Japan (and none of them by much).

Japan has paid a steep price for its density: according to the Economist, between 1980 and 2000 Japanese property prices were consistently the highest in the world, both in real terms and in relation to average income levels. Japan’s lower property prices today are simply a reflection of its slow pace of population and economic growth; if the economy of Japan is to rebound, it will need to find a way to make due without much physical space. Indeed, even today, following two decades of deflation, Tokyo is the fifth most expensive city in the developed world and the eighth most expensive city in the entire world to buy an apartment in.

Can technology finally allow Japan to overcome its lack of space? To a certain degree the answer may be yes. Japan’s vast multitude of mountain valleys, for instance, are no longer nearly as isolated as they were even just five years ago. Today, with the modern Internet, their inhabitants can access national markets and social networks, and can increasingly bargain collectively for goods and services. Over the next decade they may become even less isolated, as technology is likely to sharply reduce traffic on the country’s crowded road network (which will also free up plenty of room in Japan’s large cities), gasoline prices may remain lower than they have been in recent years, and elderly and retired Japanese may travel less frequently than Japanese populations have done in the past.

Japan’s mountain regions may also be aided by technologies like the Aeroscraft, an airship the length of a football field that is currently being developed in the US as a response to the difficulties its military has faced in mountainous landlocked Afghanistan. The Aeroscraft could allow non-bulk goods to be shipped efficiently in mountain valleys where there is not enough cheap land available for significant airports, and where the need to take-off and land in each individual valley makes ordinary airplanes (which have extremely high take-off costs) highly inefficient. While it is impossible to know for sure, it seems possible that Aersocraft airships will be ready for regular use within five to ten years. In addition to helping Japan’s mountainous territories better participate in the Japanese economy, they could potentially also help Japan access markets in nearby economies like South Korea and northern China more quickly than can be done by ship.

Another way to overcome a lack of conventional space is to construct high-rise apartment buildings. Japanese cities have already done this, of course, yet they have been somewhat limited in their efforts to do so by the high cost of construction. Going forward, however, such costs may decline. As Japanese workers retire en masse, for example, and as many white-collar jobs in Japan begin to be automated or outsourced while more work can be done from home offices because of the Internet, Japan is likely to see a large number of its commercial high-rises transformed into residential buildings. While this transformation is not inexpensive, it can be done at a tiny fraction of the price of building a high-rise from scratch.

In addition, if commodity prices remain low, and if China’s enormous construction frenzy finally ends, Japan will find it much cheaper to import building materials. It might even be able to import some skilled Chinese engineers, or Chinese-built apartment modules. Indeed, modular construction might might significantly reduce both the costs and the required labour and time of high-rise construction. This could be a huge help for a country as incredibly compact and mountainous as Japan.

In Search of a Unified Theory 

How will Japan’s real estate, demographic, commodity, commercial, sociopolitical, and income factors combine in the years ahead? It is not clear. What is clear, though, is that ignoring Japanese stocks remains something that cannot be done lightly. Japan’s economy continues to have Potential. With the Nikkei still relatively cheap on a price-to-earnings and price-to-book basis, then, it is not surprising that the recession has not led to a market drop. The cat may yet be alive.

Europe and Arabia: A Geopolitical Perspective

As different as the Quran is from the New Testament, or the Constitution of France is from the Constitution of Saudi Arabia (which is, in fact, the Quran), these differences are arguably less important than those which seperate the geography of Europe from the geography of the Arab world.

Europe is a region of islands, peninsulas, mountains, rivers, forests, and marshes: natural barriers that have historically hindered the development of a unified European identity. The Arab world, on the other hand, is in effect an enormous coastal desert, stretching for nearly 8000 km from the Atlantic to the Indian Ocean and yet, with the exception of some notable mountain ranges, containing few internal barriers of any sort. This comparatively open landscape of the Arab world has allowed it to achieve a level of linguistic, religious, and cultural unity that Europe has rarely if ever been able to match.

While the Desert and its coastal seas act as unifying force within the Arab world, the fact that significant supplies of freshwater can be found in just a few scattered areas within its gigantic territory (mostly in mountains, as in Morocco, Algeria, and Yemen, or in rivers, as in Egypt, Sudan, and Iraq) has meant that the pan-Arab identity it has fostered must compete with a wide assortment of intra-Arab identities, which in most cases have been far better than pan-Arabism at winning the allegiances of their inhabitants. In addition, the geographic division between the Middle East and North Africa has led to sharp ethno-linguistic and political divisions between Arab and Berber peoples within countries like Morocco and Algeria.

The desert geography has also tended to make the Arab world relatively poor, again in stark contrast to Europe, which has become rich as a result of the commercial navigability provided by its numerous slow-flowing rivers, long coastlines, and sheltered seas and fjords, as well as by its luck in possessing a temperate climate and natural resources like freshwater, farmland, timber, and coal.

These opposing geographies have underlain the great historical contest between the “civilizations” Europe and the Arab world have cultivated for themselves. The advantage was first with Europe, arguably, as Italy, led by Rome, was able to conquer the entire Mediterranean basin as well as Mesopotamia, defeating the Carthaginians (a powerful Semitic empire based out of what is now the Arab state of Tunisia, which had controlled much of North Africa and Spain and were ethnically linked to the Phoenicians in the Eastern Mediterranean) and other African and Middle Eastern groups in the process. Even following the decline of the Christian Roman Empire, most of the inhabitants of the Middle East and North Africa continued to be ruled by Rome’s successor, the Greek-led Byzantine Empire (which was also Christian), for several hundred years.

Eventually the tables turned, however, and around 600 CE the Arabian Peninsula united under Muhammad and then expanded its control outward during the rule of his immediate successors, quickly conquering Spain, most of France (for a very brief period), and a large part of Asia. In turn, the Arabs were invaded and occupied by Central Asian groups like the Mongols and Turks; however, in a sign of Arab influence, most of the conquering Turks ended up adopting the religion of the conquered Arabs, and long outlasted the Mongols.

While the Arabs then lost their beloved Spain after a more than 700 year long struggle with Christian forces to keep hold of it, the Muslim Ottoman Turks made up for the loss by conquering all of southeastern Europe as far as the Austrian capital of Vienna, which they besieged in 1529 and again in 1683. Muslims also continued to spread the faith into Southeast Asia: much of what is now Indonesia, which today has the world’s largest Muslim population by far, adopted Islam during the 1400’s or 1500’s, many centuries after the lifetime of Muhammad.

Of course, the Europeans ultimately regained the advantage over their Muslim neighbours. During the late 1400’s the Portuguese first sailed a route to India which avoided passing through Turkish or Arab-held territory, while, around the same period, the Spanish reached the Americas and the Russians surged into Muslim Turkic Central Asia, conquering territory they mostly continue to hold today. The greatest blow to Islam then fell in the 1700’s and 1800’s, as the Muslim Mughal Empire, which at its height had governed over almost a quarter of the world’s population, lost its hold on the Indian subcontinent to the British. The colonizing Europeans also took over Muslim populations in places like Africa and Southeast Asia.

During the 1800’s and early 1900’s, the Ottoman Turks forfeited southeastern Europe and the Arab world in a series of assaults aimed at them by European powers like the British, French, Russians, and Austrians. The Persian empire was heavily intruded upon by both the British and Russians. Finally, in the 1970s, the last super-sized Islamic state, Pakistan, was divided into two separate countries, Pakistan and Bangladesh, which do not even border one another anymore since India lies between them. Today Pakistan and Bangladesh are the world’s sixth and eighth most populous countries, respectively.

For many people, the battle between Europe and Arabia, or between the West and Islam, continues to this day. After losing its main source of wealth when Europe stole the control of trade with India and China away from it, most of the Middle East seemed likely to become somewhat irrelevant to global politics. Instead, it gained a new source of wealth in the modern era: oil. As recently as 2010, more than 15 percent of world oil production occurred in Saudi Arabia alone, while an additional 15 – 20 percent occurred in other Arab countries and 40-50 percent occurred in the Muslim world as a whole.

The Muslim world also accounts for close to a third of world natural gas production (led by Iran, Qatar, Saudi Arabia, and Algeria), and is estimated to possess over 60 percent of the world’s “conventional” proven reserves of natural gas (not including gas from shale) as well as over 50 percent of non-shale oil reserves and over 75 percent of oil reserves that are neither from shale nor from oil sands.

Today, partly as a result of the energy wealth it has gained during the past century, the Arab world has a population of approximately 380 million (in contrast to a century ago, when its population was significantly smaller than even any of the major European nation-states were at the time, without even counting the Europeans’ overseas empires) and a nominal gross domestic product of just under 3 trillion dollars. This means that, if the Arab world could somehow reunite politically, it would have the third largest population and fifth largest economy in the world. It would, in other words, become a Great Power again.

Needless to say, few of the Arab world’s neighbours want to see any serious pan-Arab union come into being. Arab unification was in fact very briefly attempted in modern times, in a formal sense, with the joining of Egypt and Syria to form the United Arab Republic, which lasted from 1958 to 1961. From a purely geopolitical perspective, the potential of such cooperation between Arab countries is especially worrying to regions like Europe because of the Arab world’s shared religious identity – and to a lesser extent, shared cultural traditions and linguistic affiliations – with other parts of the Middle East and Muslim world.  The “classical” version of the Arab language, which is understood by scholars (and other people too) in every country of the Islamic world because it is the language of the Quran, is one potentially important example of a unifying factor throughout the Middle East.

If combined with non-Arab Middle Eastern neighbours Turkey and Iran, the population of the Arab world would rise to more than 530 million and its GDP would rise to more than 4 trillion dollars. The states that comprise the Organization of Islamic Cooperation, meanwhile, have a combined population of approximately 1.6 billion and a GDP of approximately 7 trillion dollars — and they do not even include the estimated 180 million Muslims living in India, 25 million living in China, 16 million in Russia, or 20 million living in the European Union.

While in the West there is much talk of the Muslim world being stuck in an economic decline, Muslims actually continue to have a higher per capita income than Hindus do, or than Christians in Sub-Saharan Africa do. Many Muslim countries have a higher per capita income than China does, even today following decades of rapid Chinese economic growth. The past decade has in fact been a terrific one for most Muslim economies, with oil and gas prices rising sharply, the developing world as a whole growing solidly, and a number of countries with large Muslim populations, most notably Indonesia, Turkey, India, and Nigeria, growing very quickly.

Apart from economic growth, the Muslim world’s geopolitical trajectory has also been positive in the past generation, mainly as a result of the collapse of the Soviet Union having freed about 60 – 90 million Central Asian Muslims (the exact number depends on whether or not you count Soviet-occupied Afghanistan as part of Central Asia) from Russian rule, along with the gigantic, resource-rich region they inhabit.

Since then, some Muslims have been hoping or pushing for a further Islamic geopolitical revival, which many non-Muslim countries would obviously not be happy to see. Pan-Islamic sentiments have, to varying extents, found their way into local and regional disputes between Muslims and non-Muslims throughout the world, in places like Kashmir, western China, Palestine/Israel, various African countries, various Southeast Asian countries, the Caucuses (both within Russia and without), and the Balkans. Arguably, technologies like the Internet have been strengthening pan-Islamic identities as well.

The West has, of course, generally aimed to gain influence within the Arab world, in part to prevent it from ever becoming too closely united. Europe, Russia, and the US have historically been focused on gaining influence in Egypt, for example, as Egypt has by far the largest population of any Arab country, is more internally stable and united than any other large Arab country, and is strategically located, sitting directly in the centre of the Arab world and encompassing the Suez Canal.

The West has also focused on gaining influence in the Persian Gulf, in particular by allying itself closely with the tiny energy-rich Gulf monarchies (Kuwait, the UAE, Qatar, Oman, and Bahrain), as well as with  the royal family of Saudi Arabia and, not too far away, the Israelis, the Iraqi Kurds, and the royal family of Jordan. Given that the West is in some ways more powerful today than at any time in history (largely as a result of the rise of the US, which was completed with the fall of the Soviet Union), and that the Persian Gulf region is sharply divided between Arabs and Iranians, Sunnis and Shiites, and Iraqis and Saudis, gaining influence there has not been too difficult for the West to achieve.

And so, even leaving aside social values or issues explicitly tied to religious belief, many Arabs believe the West is acting unjustly or aggressively towards them. Most believe that the current political borders of the Middle East are “artificial”, imposed on them a century ago by ignorant or sinister British and French politicians. There is certainly truth to this, though, in defence of the British and French, many of the borders that were drawn actually did accurately reflect existing social and geographic divisions within the Arab world.

With a few possible exceptions, such as Kuwait and Lebanon (which arguably should not have been created as independent states), Israel and Palestine (which arguably should have been created as a single state, perhaps even including neighbouring Jordan as well), and Kurdistan (which arguably should be created out of parts of Turkey, Iran, Iraq, and Syria, though even this is more complicated than it is often portrayed), it is not clear that the borders in the Middle East could actually be all that improved upon. But of course, this is a topic worth debating in much greater detail.

It is also not only the West that has been responsible for messing with the “natural” borders of the Arab world. Iran and Turkey, for instance, both refuse to give up Arab-inhabited regions of the Fertile Crescent they possess; a more consistent geographic or cultural rendering of Middle Eastern borders should perhaps have included Turkey handing over its province of Hatay to Syria (as Syria still officially claims it should) and Iran handing over its province of Khuzestan to Iraq.

Yet most people who complain of Western-imposed artificiality among the borders of the Arab world are not concerned with either of these areas, even though both are significant to the politics of the region (especially Khuzestan). Indeed, while Arab bitterness toward Europe’s past imperialism remains wholly justifiable, complaints of imperialistic European map-drawing in the Arab world nevertheless tend to be somewhat exaggerated. If you want to see truly unfair and dangerously-drawn borders the Europeans were responsible for, you should not even begin to think of the Middle East, but look instead to regions like West Africa.

The Coming US-Argentine Tango

Argentina has the world’s 20th largest economy, 8th largest territory, and 30th largest population, according to the World Bank. Yet Americans have historically had little to do with the place. The United States and Argentina have never been close allies, nor have they been hated rivals. Today the two countries trade just $15 billion or so with one another: Argentina is just the seventh biggest trade partner of the US in Latin America, and the US is only the third biggest trade partner of Argentina. Most Americans cannot name a single Argentinian person, past or present. No, not even Lionel Messi!

There are a number of fairly straightforward reasons why the US and Argentina have not become too close to one another in the past. Interestingly, however, there are also a number of reasons why the US and Argentina might become quite close in the future. Given the size of both countries, any such move towards one another could represent a significant evolution in world affairs. Let’s try to lay out the case for why this might happen, then, beginning by looking at some of the reasons why Argentina and the US have never been close in the past, and then moving on to why they might finally become so in the years or decades ahead:

1. Distance

Even in the modern world, there remains a strong correlation between physical distance and international trade. This correlation matters for trade between the US and Argentina, since the two countries are located on extreme opposite ends of the Western Hemisphere. The flight from New York City to Buenos Aires takes about 11 hours, for example; it is longer even than the flight from New York to Moscow, or from Buenos Aires to Johannasburg. Flying from Las Angeles or Chicago to Buenos Aires is longer still.

By ship, Argentina and the US are even further apart than they are by air, since the detour around Brazil (which juts far out into the Atlantic Ocean) adds an additional 2500 km or so to the trip from New York to Buenos Aires. That makes it about 30 percent further by ship than by plane. In addition to this detour around Brazil, the journey through the Panama Canal adds a significant amount of time, canal fees, and size limitations to container ships travelling from the US West Coast to Argentina. And taking an overland shortcut through Chile can still be very difficult for transporting bulk goods, as there are no railways or all-season roads which fully cross the Andes Mountains.

3-623-31031-XWesternHemiPhy

Argentina’s trade is not only impacted by its physical isolation from the US, but also by its physical isolation from Europe and East Asia. Sailing from Buenos Aires to Shanghai, for instance, whether by going westward across the Pacific Ocean or eastward across the Atlantic and Indian Oceans, is roughly two and half times further than sailing between Las Angeles and Shanghai. Sailing from Buenos Aires to Paris is around two times further than from New York  to Paris. Partly as a result of this phsyical isolation, Argentina is not well-integrated into global trade networks.

In fact, Argentina’s overall international imports and exports of goods are equal to just around 25 percent of its GDP, according to the World Bank. This is the second lowest share in the entire world among developing countries (see graph below). Plus, nearly a quarter of Argentina’s trade is with Brazil, which is even less trade-oriented than Argentina is. Thus, in addition to not trading much with the US directly, Argentina also does not have much to do with the global commercial system as whole, and therefore also has few indirect commercial connections with the US.

trade as % of gdp in developing economies[Note, by the way, that Argentina is an exception to two different trends displayed by this graph. The least trade dependent economies tend to be extremely large — like Brazil, Russia, India, Indonesia, China, and to a lesser extent Turkey and Mexico — and/or tend to have relatively low per capita incomes, like Nigeria, India, Indonesia, Colombia, Iran, and to a lesser extent China and Venezuela. These trends exist not only among the countries shown in this graph, but also throughout the world as a whole: the least trade dependent economies tend to be either giants like the US, Japan, and Brazil, or else are some of the most impoverished states in the world, like the Democratic Republic of the Congo or the Central African Republic. Argentina is neither extremely large nor relatively poor (it has a per capita nominal income of around $15,000, which is higher than the Latin American average and more than double that of China), yet it is still second from the bottom in terms of its dependence on trade — not only on the graph above, but also among all of the countries in the world, according to the World Bank]. 

2. Economics

Argentina’s economy is driven to a decent extent by its farm output. According to the World Bank, Argentina has more arable land per capita than any country in the world apart from Australia, Canada, or Kazakhstan. Agricultural goods like corn, wheat, and especially soybeans account for well over a third of Argentina’s net export revenues. It also produces the most beef of any country apart from the US, Brazil, China, or India.

This has historically put Argentina in direct competition with the United States, which in the past was an agriculturally-oriented society, and even today remains the world’s largest producer of both soybeans and corn, and the world’s largest exporter of grains in general. Though at present agricultural goods account for perhaps no more than 5 percent of US exports, they continue to play an outsized role in American politics, because their production is spread out across many different states, municipalities, congressional districts, etc. Thus, the US and Argentina continue to compete economically, to a certain degree.

It might be tempting to say that the same is true of Brazil, which is the world’s second largest producer of soybeans and beef, and third largest producer of corn. But actually, most of Brazil’s export revenues come from goods that are net imports of the United States and Argentina, such as oil, iron ore, coffee, and sugar. Partly because of this, in fact, Brazil exports approximately 7.5 times as much to the US as Argentina does, even though Brazil’s overall exports are only 3.5 times larger than Argentina’s overall exports.

3.  Language 

Because of the high utility of the Spanish language, Latin America is one of the worst regions in the world at speaking English. According to English First, “Latin America is the weakest [at speaking English] of all regions, with an average English proficiency score barely surpassing the low proficiency cut-off.” (Spain, similarly, is far behind the other major countries in the European Union in terms of its English language proficiency). Argentina is no exception to this pattern. Only 6.5 percent or so of its population has a “high” level of English proficiency, according to this article. 

In addition to serving as a commercial barrier between the two countries, the Spanish-English linguistic division has also helped keep the US and Argentina apart in the political sphere. Argentina’s Spanish identity, for example, has given it ties to countries which the US has had rivalrous relations with in the past, such as Cuba, Venezuela, Ecuador, Mexico (where the US invaded Mexico City during the 1840’s, and Veracruz in 1914), Spain (which the US fought a globe-spanning war against in 1898, and which had a fascistic government during middle of the 20th century), Nicaragua (which the US occupied in the 1910s and 1920s, and supported guerillas in during the country’s civil war in the 1980’s), Panama (invaded by the US in 1885, and again in 1989), and others. America’s English identity, similarly, has helped given it relatively close ties to Britain, which Argentina fought a war against in 1982 over the Falkland Islands, resulting in more than 900 deaths.

4. Geopolitics

While today Argentina is generally seen as being an insignificant country when compared to its larger neighbour Brazil, this was not always the case. As recently as the 1950s, Argentina’s economy was actually estimated to be larger than Brazil’s. Brazil aslo used to be much more internally divided along both regional and racial lines than it is today (and even today it is highly divided along both regional and racial lines), in relative contrast to Argentina where the population and political power was more closely unified. Indeed, rather than Brazil, it was Argentina and even Chile which were the major military and naval powers native to the region until at least the early part of the 20th century. Plus, because Brazil spoke Portuguese rather than Spanish, its potential influence within the rest of Latin America or Spain seemed comparatively limited. Many therefore predicted that Argentina, not Brazil, would wind up emerging as South America’s “Great Power”.

Of course, the US does not take too kindly to fellow Great Power hopefuls. Thus, it saw no reason to become too chummy with Argentina, particularly following Argentina’s relative victory over Brazil in a war for Uruguay in the 1820’s, and Argentina’s decisive victory over Paraguay during the 1860’s (in a war in which arguably 90 percent of Paraguay’s entire male population died, making it perhaps the deadliest war for a country in modern history). When, for example, the US convened the first-ever International Conference of American States – the precursor to today’s Organization of American States – in 1890, hoping to implement a hemipshere-spanning trade union and formal political network, the conference resulted in feuding between Argentina and the US, and to a lesser extent between Chile and the US, which prevented the US’s political goals from being realized.

Argentina later irked the US during the begining and middle of the 20th century when, partly as a result of the fact that its population had some significant Italian and to a lesser extent German roots, it took a relatively sympathetic position toward US’s adversaries in the World Wars. To this day, Americans often associate Argentina with its providing of shelter to prominent Nazis fleeing Germany following the end of the war. Following the end of the war in 1945, in fact, the United States even briefly tried to keep Argentina out of the newly-created United Nations. Brazil, in contrast, was the only independent South American country to send soldiers to fight on the side of the Allies during the war.

Later still, during the Cold War, the Soviets hoped to gain influence in Latin America to serve as leverage against the United States. While the US was mainly concerned with the close-to-home governments, geurillas, or criminal organizations in places like Cuba, Venezuela, Colombia, and Central America, the bond between Latin American nations meant that the US often viewed the left-wing governments of countries further south, like Chile (such as that of Salvador Allende, who was killed in 1973 in a military coup sponsored by the CIA) and Argentina (such as that of Isabel Peron, who was toppled in 1976 in a military coup that may have been sponsored or supported by the US government), as potential threats as well.

5. Politics 

Argentina and the US are in some ways exact opposites of one another in terms of their political culture and internal geopolitical structure. In the US, no single region holds a majority of national economic power; rather, the country’s economic activity is spread out among a number of different influential regions, such as California, Texas, Florida, the Northeast, the Midwest, the South, and so on. The largest urban area in the US, in and around New York City, only has around 5-10 percent of the country’s total population, while the largest region, the Greater Northeast, only has around 15-20 percent.

Even within the US’s Greater Northeast region, economic power and influence is spread out between a sizeable number of major states, all of which have had their own unique assets — politics in Washington, finance and culture in New York, education and technology in Massachusetts, coal and natural gas in Pennsylvania, shipping and gambling in New Jersey, manufacturing in Michigan and Ohio, services and agriculture in Ilinois, etc. — as well as their own natural harbours on the Atlantic Ocean or Great Lakes with which they have historically been able to engage with the outside world. Divisions like these have arguably made it difficult for a powerful central government to form within the United States.

Argentina is perhaps the extreme counter-example of this sort of highly diffuse American system. The Buenos Aires urban area, which is the political, cultural, financial, and commercial capital of the country, is home to approximately one-third of Argentina’s overall population. Another 15  percent or so of Argentina’s population lives within the general area around Buenos Aires. No other metropolitan area in Argentina has a population that is even more than 10-15 percent as large as Buenos Aires’ is.

[Update:  In Argentina’s presidential elections this past October, the two candidates were the leaders of the province of Buenos Aires and the Autonomous City of Buenos Aires, respectively].

In addition to this, a large majority of both Argentina’s entire population and farmland is located within river basins that empty into the Atlantic at precisely the spot where Buenos Aires is located (see maps below), and the produce of these farmlands is transported almost entirely along these rivers. The farmland of Paraguay, Uruguay, and even of significant areas of Brazil is also located within this basin. Moreover, most of the Argentinian population within this basin is highly dependent on Buenos Aires to ship its produce to international markets, because there are few other natural harbours to serve as ports in northern Argentina apart from the Rio de la Plata Estuary in which Buenos Aires (and Montevideo, the capital of Uruguay) is situated.

Riodelaplatabasinmap

p1960NASA-ASTER-southamerica-map

As such, any government that is able to control Buenos Aires and the region around it faces relatively little challenge in controlling the entire country — at least, absent interference by a foreign power or neighbouring state. Buenos Aires is, in fact, probably quite a bit more influential within Argentina than even cities like London, Paris, or Moscow are within Britain, France, or Russia. Partly as a result of this, Argentina has often seen a lot of “European-style” Big Government, as opposed to “American-style” libertarianistic government. This Argentinian style did not much please the US during its Cold War against the Soviet Union, when Americans saw themselves as being locked in a struggled against centralized socialistic styles of government, which Argentina possessed in an on-and-off fashion prior to the military junta that seized formal control of the country between 1976 and 1983. Argentina also experienced military coups in 1943, 1955, 1962, and 1966.

Even today, Argentina’s government continues to support poltical and economic policies Americans think of as illiberal and overweening, such as high trade tarrifs and high government subsidies of commodities like water and gas. Similarly, the Argentinian government is overwhelmingly viewed by America’s investor class as being populist, corrupt, and dishonest brokers in longstanding disputes over the repayment of Argentina’s foreign debts. In these sorts of ways, the sharp divisions in political culture between the US and Argentina have perhaps contributed to the two countries’ continuing relative estrangement from one another.

10 Reasons Argentina and the US could finally become close in the future: 

1. The Decline of Distance 

While the influence of distance on trade remains large, it is already much smaller than it once was in the past, and may continue becoming smaller in the years or decades ahead. As was alluded to earlier, cheaper air travel could be especially likely to help boost US-Argentine ties, since the distance between the two countries by air is significantly shorter than it is by sea. The Internet is obviously another potential driver behind the potentially declining economic importance of distance — making the fact that Argentina may have the first or second highest rates of Internet access in Latin America, and among the highest in the entire developing world – especially noteworthy. Around 60-75 percent of Argentina’s population is estimated to hae Internet access, up from just 20 percent a decade ago.

Given that linguistic ties will perhaps be very important in allowing for Internet-based economic or social connections to take place, the Internet could also help create indirect ties between Argentina and the US via Mexico and the countries of the Caribbean basin, which are already close to the US commercially and socially even without the Internet. More importantly, it could create direct ties between Argentina and the US as a result of the growing ubiquity and importance of the Spanish language within the United States itself. Which brings us to point number two:

2. Spanish in the United States

As a result of the American immigration boom of the relatively recent past (see graph below), the Hispanic population in the US is currently estimated at 55 million, which means that it is actually larger than Argentina’s entire population is. An estimated 40 million Hispanic Americans speak Spanish at home, up from just 17 million in 1990. US Hispanic populations have a median income estimated at around $40,000 (not far from three times higher than Argentina’s) — compared to $52,000 for the United States as a whole.

USA-Immigration-Annual1

Even if the US’s high rates of immigration from Latin America were to decrease, the number of Hispanic Americans in higher-paying jobs and in the workforce in general would continue to grow quickly over the next few decades, as a result of the fact that there are many Hispanic children, teenagers, and 20-30 year olds in the country. The estimated median age for US Hispanics is 27 years old, for example, compared to 37 years old for the country as a whole. Most Hispanic children and teenagers are American born and raised, and are therefore much more likely than their parents or grandparents to possess the social connections, English language skills, and educational qualifications that are often the prerequisites to achieving financial success in the United States.

Hispanic Americans have also been living mostly within relatively wealthy or fast-growing US economies, such as Texas, California, New York City, Washington D.C., Washington state, Colorado, etc. If the economic and political clout of Hispanics in the US continues to grow, it may create opportunities for Spanish-speaking countries like Argentina to forge greater economic linkages with it. As was mentioned above, this relationship is likely to be particularly significant because of they continued spread and increased ubiquity and sophistication of the Internet. Online connections between Spanish-speakers in the US and Argentina could increase not only in direct terms, but also indirectly via Spanish-speakers in countries like Mexico and the Dominican Republic.

As for Argentinians living in the US, there are only about a quarter of a million. However, this number has been growing: around 60 percent of Argentinian-Americans arrived in the US after 1990, and most came since Argentina’s economic crash in 2001. Most live in Florida, California, or New York. Given that about a quarter of Argentinian-Americans live in Flordia, and that they are significantly more wealthy than the general Hispanic-American population, it is actually theoretically possible that they could play an important role in deciding the outcome of a US presidential election.

 3. Containing Brazil 

Argentina may have had a slightly larger economy than Brazil back in the 1950s or 1960s, but that is hardly the case today. Brazil’s economy has grown to become the world’s sixth or seventh largest, both in nominal terms and adjusted for purchasing power. It is close to quadruple the size of Argentina’s and ten times that of Venezuela’s (Brazil’s next largest neighbour). Brazil’s population, meanwhile, is the fifth largest in the world, around five times larger than Argentina’s and almost two-thirds as large as the US’s. And of course, Brazil’s territory remains enormous, nearly as large as the US’s, Canada’s, or China’s, and triple the size of Argentina’s.

Brazil has the world’s largest resources of freshwater and biodiversity, and it is the second largest producer of soybeans and iron ore, the third largest oil producer outside of the Middle East or North America, and the largest producer of coffee, sugar, raw tobacco, meat products, fruit juice, wood pulp, and a number of other commodities. Brazil has also become the world’s seventh largest motor vehicle manufacturer. (Argentina, meanwhile, is the 19th largest motor vehicle producer; the per capita motor vehicle production of Argentina and Brazil is about the same).

In the past, Brazil’s economy has been hurt by the difficulty of developing its challenging terrain, unifying its disparate regions, accessing the far-away markets of North America, Europe, and Asia, and overcoming its racial and class divisions (Brazil arguably has the most class-based income inequality of any major country, and, relatedly, was the last country in the Americas to outlaw slavery, in 1888). If, however, Brazil can overcome these challenges, perhaps helped by technological advances to do so, it could maybe become a great power in the decades ahead. Notably, unlike in other Great Power aspirants, such as the former Soviet Union, India, or even China, the internal regional divisions in Brazil are not overlain by internal linguistic divisions or milleania-old historical divisions. Nearly 100% of Brazilians speak Portuguese.

If Brazil does end up becoming a Great Power, a US-Argentine relationship would probably form to try and contain it. A powerful Brazil would almost by definition make Argentina feel threatened, for a number of reasons including that Brazil’s influence in Uruguay – a  country of just 3 million people, which was part of Brazil until Brazil lost a war to Argentina in the 1820’s – would put it much too close to Buenos Aires for Argentina to feel comfortable with.

map-of-uruguay

From the US’s perspective, meanwhile, if a Brazil was able to eventually take control of Argentinian politics – whether formally or informally – it might be able to use Argentina’s resources (and also Uruguay’s, Paraguay’s, and Bolivia’s) to become more powerful still. Given that Brazil also has ties to the rest of Latin America and Spain, since Portuguese and Spanish are really not all that different, such a move could theoretically allow Brazil to become a rival global superpower to the United States. The US would almost certainly not want to take the chance of allowing that to happen, and so would probably prefer to ally itself closely with Argentina to begin with to make sure that it never does.

4. Shale Gas 

Today, an estimated 40% of US natural gas production (and the US produces the most natural gas in the world) comes from shale deposits, as does 15% of Canadian natural gas production (and Canada produces the world’s fourth most natural gas). And yet, because of the various challenges associated with shale production, no country in the world apart from the US or Canada produces any significant quantity of shale energy. And even US and Canadian shale production only began in earnest less than a decade ago.

Going forward, it may be that there will be diminishing returns in the US and Canadian shale gas production industries, such that their production costs will rise over time in comparison to the potential production costs of shale gas deposits in other countries. This could make American energy companies – the only ones with the expertise required to produce significant quantities of shale gas – look abroad for gas to develop. Outside of North America, the two largest shale gas reserves are thought to be in China and Argentina. Argentina is also thought to have the fourth highest shale oil reserves, behind only the US, Russia, and China.

Developing China’s shale gas reserves could be difficult for American companies, not only because of potential political barriers between the two countries, but also because of China’s high population density and shortage of freshwater (which fracking uses intensively) in some of its gas-rich regions, and because China’s basins are is in many cases more difficult to develop from a geological standpoint than American ones are. Developing shale reserves in Russia could also be very difficult for US companies.

Argentina, on the other hand, seems like a relatively favourable location for shale gas production. Argentina also wants to boost its gas production, since in recent years its demand for gas has outpaced its domestic supply, forcing it to become dependent on imports from Bolivia. And it has the gas pipelines to do so in place already, since it is has long been a major conventional gas producer (it produces around 13 times more natural gas per capita than China does). This is important, since natural gas cannot be transported in trucks, trains, or barges, like oil and coal can, but instead must have pipelines to move from the site of production to the markets of consumption. Argentina could perhaps become the next mecca for American energy companies, therefore. Chevron has already gotten the ball rolling on this, investing over a billion dollars in the country in 2013.

5. Mexico, the Carribbean, Central America, and Spain  

Argentina may be located on the oppopsite site of the globe from the United States, but Mexico, the Carribbean islands, Central America, and to a lesser extent the northern countries of South America and Spain are not. If these Spanish-speaking countries can become closer to the United States, it could create closer indirect ties between Argentina and the US (though, of course, the reverse of this is also true: if Mexico and the United States were to have a falling out as a result of drug trafficking or immigration issues, for example, it could potentially damage US-Argentinian relations in an indirect way). So, in what ways could these countries be likely to become closer to the US in the years ahead?

One area, of course, is outsourcing. In recent decades, when the United States was looking to save money by outsourcing its manufacturing base, it frequently chose to do so in China. Today, however, Chinese exports are increasingly expensive, and the US increasingly views China as a potential rival. It may be that the US will need to find new locations to outsource to in place of eastern China. Many see India as the likely candidate for this, and maybe they are right; however, the fact is that India, because of its intense regional internal complexities, lacks the political and commercial economies of scale that helped make China (and Japan, and Northeast Asia as a whole) such a significant exporter to the US during the past half century or so. Moreover, unlike Northeast Asia, India is located far closer to wealthy consumers in Europe, East Asia, the Persian Gulf, and Australia than it is to the US, so it may be that its economic ties will mainly be to those areas, rather than to North America. The US, then, may find that Mexico, Central America, and the Carribbean are the economies most likely to become its “next China”.

map

Mexico is already well along this path. Its exports to the US have benefited not only from cost increases in China, but also from the Texas shale gas boom, which, because gas cannot be shipped cheaply overseas like oil can, the Texans have been exporting huge amounts to Mexico, which has been helping to keep the cost of Mexican electricity relatively competitive. US exports to Mexico are up almost 450 percent since 1993 (when NAFTA was finalized), while Mexican exports to the US is up more than 600 percent since 1993.

Meanwhile, if the US and Cuba can finally mend fences, it could also obviously be a huge development, since Cuba is not only the largest Caribbean state, but is also located much closer to the US than any other. Given how slowly container ships move, this proximity to US markets could be very important for companies that are using “just-in-time” logistics as more have increasingly been doing as a result of the ability to use sophisticated computer programs to organize logistical networks. Indeed, any move toward “just-in-time” logistics would help grow US trade with Mexico and the Carribbean in general.

The proximity of this region to the US could also help it to grow its American and Canadian tourist industry, which for a number of reasons could increase a lot in the future. (For example, because of the growing number of American retirees, or the possibility of growing seasonal American unemployment as a result of job automation, or the increasing ease of being away from home for longer amounts of time because the Internet). In 2014, just under three-quarters of the estimated 68 million US  tourist visits abroad were to countries within the Americas.

Trade between South America and the US, meanwhile, could also increase because of possible changes in technology. If, for example, machines allow North America to take back much of the world’s manufacturing industry from Asia, it could cause countries like Peru, Chile, and Colombia to export more of their mineral resources northward to the US instead of halfway across the world to Asia. Similarly, the development of once-remote African, Siberian, or Central Asian mineral resources could lead Asian (and European) manufacturers to rely less on South American natural resources than they do today, which could also free them up to be sold to the United States instead.

It is probably also worth mentioning that in the past generation there has been a huge religious shift within Latin America, and particularly within Central America, whereby tens of millions of people who were raised Catholic have switched to become Protestant evangelicals (or, to a lesser extent, to become religiously unaffiliated or atheistic). The share of Protestant evangelicalism has risen from an estimated 4 to 19 percent of Latin America’s population since 1970. Given that more than 50 percent of the US population is Protestant, and that maybe 25 percent are Evangelical, this religious shift might influence relations between the US and Latin America to some degree. In Argentina, meanwhile, an estimated 15 percent of people are now Protestant, more than half of them new converts. Argentina’s population also has the highest rates of secular or atheistic people in Latin America apart from Uruguay, Chile, or the Dominican Republic, also giving it something in common with the “developed” world.

Finally, US ties to Spain will perhaps remain relatively close during the decades ahead. One reason for this is that the US is highly dependent upon Spain’s Strait of Gibraltar in order access to the Mediterranean Sea (and by extension, to access the Indian Ocean and the Black Sea). Another is that the US may want a strong ally in Europe in addition to Britain, in order to keep any potential relationships between major continental European powers like Germany, Russia, and France in check. Spain is arguably a likely candidate to become this ally, since Spain’s economic ties with Germany and Russia are very small compared to, say, Italy’s, France’s, or Turkey’s ties with Germany and Russia. Moreover, Spain has a potential connection to Spanish-speakers in the US, and it already has a relatively significant economic relationship with Britain (and could become by far the main destination for British Baby Boomer retirees in the coming years). Indeed, Spain has already been one of the US’s main European allies in modern times, for example sending more troops to both Afghanistan and Iraq than any European country apart from Britain, Poland, Italy, or the Netherlands.

 6.  Food Exports 

As was mentioned earlier in the article, Argentina and the US have often been economic competitors of one another in the past, as a result of both being major food exporting nations. Today they are still competitors in global food markets, though because the US economy is no longer as agriculturally-oriented as it once was, they do not always compete to the same extent as they used to in the past. If Argentina could reduce its dependence on agricultural exports as well, it could further cause the level of economic competition between the two countries to fall. Of course, the reverse of this is true as well: if Argentina and the US are able to increase their agricultural exports, they would maybe become more competitive with one another again.

One area to watch here is biofuels. Both the US and Argentina (but especially the US) are world leaders in biofuel production, and both might try to increase their biofuel production going forward in order reduce their dependence on oil imports and reduce their carbon emissions. Already, for example, about 40 percent of the US’s world-leading corn production is used to create ethanol, which accounts for around 10 percent of the fuels used by American vehicles. Argentina’s overall biofuel production is lower than the US’s, but its per capita biofuel production is quite a bit higher than the US’s.

If biofuels become the next big thing in “renewable” energy production, such that Argentina and the United States start using much more of their corn and soybean production to create biofuels to use domestically in their transportation sectors, then they will probably not be exporting nearly as much food as they do today, and so will not be competing as much with one another economically. If, on the other hand, their biofuel production decreases, then they could start competing with one another more in global food markets again.

Finally, in the decades ahead world food markets could perhaps be transformed by technology. If new technologies allow countries with a lot of remote, under-developed, or “unconventional” farmland – like Kazakstan, Russia, Brazil, Australia, Africa, etc.. – to become major grain exporters for the first time, or if it allows countries with little farmland but a lot of capital – like Germany, Japan, South Korea, etc.. – to become larger grain exporters, then countries that have historically dominated global grain exports, like the US (along with Canada) and Argentina (along with Paraguay and Uruguay), could find themselves in a much more diverse global food marketplace. If more countries turn in to major food exporters (which in fact did happen during the decade of the 2000’s, for instance with the quadrupling of Brazilian soybean exports, which led to increased Argentinian-Brazilian economic competition), it could potentially reduce the level of competition between Argentina and the US.

7. Bridging the Andes

Argentina and Chile are the second and fourth largest economies in South America and the 48th and 50th richest countries in the world in terms of their per capita nominal GDP. They both speak Spanish, and they share a land border that is more than 5000 km long, the third longest border between any two countries in the world. Argentina’s capital of Buenos Aires is only 900 km from Chile’s capital of Santiago, while Argentina’s fourth largest city, Mendoza, is just 150 km from Santiago.

In contrast, Santiago is 2500-3000 km from Sao Paolo (Brazil’s largest city by far), Rio de Jaenaro (Brazil’s second largest city by far), or Lima (Peru’s largest city, and the second largest city in South America). It is 1400-1800 km from the largest cities of Paraguay and Bolivia, and 4200-4800 km from the largest cities of Colombia and Venezeula. In addition to their physical proximity, both Argentina and Chile could also potentially use one another as very significant short-cuts in order to access the Pacific Ocean (for Argentina) or the Atlantic Ocean (for Chile).

image002

And yet, Argentina and Chile actually do not have all that much to do with one another.  There is some trade and travel between the two countries, but not nearly as much as one might think. The reason for this is that the Andes Mountains sit in between the two countries, and they are such a formidable barrier that, even today, there are no railways or all-season roads that cross them. The lack of railways between the two countries is especially significant, because Argentina and Chile mainly produce bulk goods like grains (for Argentina) and minerals (for Chile), neither of which can be transported long distances efficiently by truck in most cases.

Relieve-de-America-del-Sur-864

In the future it might be that Argentina and Chile will overcome the Andes, whether through a tunnel with a railway through it (which they are hoping to finally build within the next decade), or by air travel becoming cheaper (whether passenger flights or cargo flights), or by more reliable mountain roads being constructed and maintained, or by cyberspace becoming more important, or by gas pipelines (which already exist — see map below) exporting more of Argentina’s natural gas to Chile’s gas-hungry economy. If this were to happen, the two countries might form a very close relationship. Though it is not likely to result in their fusing to become a single country, the future synergy between Chile and Argentina (Chargentina?) might become extremely significant.

CAM989

This could have an affect on US-Argentina relations, for several reasons. First, the US could see Argentina-Chilean cooperation as being worhty of political engaegement, since a connection with Chile could help Argentina to more successfully ensure that Brazil never becomes a great global power. Second, a railway linking Chile to Argentina could do a lot to help boost trade between Argentina and the US West Coast. From Chile’s northern commercial port of Antofogasta to Las Angeles by sea, for example, is less than half the distance from Argentina’s northern port of Buenos Aires to Las Angeles via the Panama Canal. Antofagasta to Las Angeles is even shorter than from Buenos Aires to Miami.

Lastly, a connection between Argentina and Chile could create an indirect connection between Argentina and the US. This is because the Chilean economy is much more closely integrated with the US economy than Argentina is. Whereas in Argentina trade with the US only accounts for about 8 percent of total Argentinian trade, and Argentina’s total trade only accounts for about 25 percent of Argentina’s GDP, in Chile trade with the US accounts for about 16 percent of total Chilean trade, and Chile’s total trade accounts for an estimated 56 percent of Chile’s GDP. In other words, Chile’s trade with the US relative to the size of its GDP is more than four times as large as Argentina’s is.

Even leaving Chile aside, Argentina could also find the Andes Mountains less imposing in the future because of the completion of the large expansion to the Panama Canal, which is expected to finally be complete (after having been delayed several times) in 2016. The expansion is supposed to allow ships carrying up to arount 13,000 containers to use the canal, up from around 5000 containers today. The expansion could help Argentina access the US West Coast, and could help Pacific Latin American countries, like Chile, Peru, Ecuador, and El Salvador, access the eastern half of the US. Similarly, improvements in the overland intermodal transport networks of countries like the US, Mexico, Panama, or Costa Rica could help in trade between the two sides of the American continent, which could have both a direct and an indirect positive influence on US-Argentinian trade.

8. The Falkland Islands

In 1982, Argentina invaded the Falkland Islands (which it calls the Malvinas Islands), prompting a war with Britain, which successfully counter-invaded the islands. Around 900 people were killed. Though certain elements of the US government (including, arguably, then-president Reagan) were sympathetic to the Argentinians claim on the islands, the US ultimately supported Britain in the war, hurting US-Argentine relations.

fksa

Today the Falklands is still a tense issue in British-Argentinian relations. However, as the population of Britain is now another generation removed from its grand imperial past (remember, even as late as the 1970’s Britain still formally had a pretty huge empire), and as Argentina is no longer ruled by an intensley right-wing military junta as it was in the late 1970s and early 1980s when the war occured, and as the Falklands/Malvinas Islands are only home to fewer than three thousand people to begin with, it seems possible that it will become less and less problematic of an issue going forward.

If Britain and Argentina can finally manage to sort out the Islands issue, it might help to boost US-Argentina relations. In fact, even if Argentina and Britain cannot sort out the issue without another conflict, US-Argentinian relations could perhaps improve if the Argentinians become pleasantly surprised by US neutrality (or perhaps even outright support for Argentina) in any future spat (or war) over the islands.

9. The Antarctic Connection 

World maps tend to be somewhat misleading, since they often tend to make areas nearer to the north and south poles – like Greenland, for example – a lot larger than they actually are in the real world. This stretching applies to Argentina too, since Buenos Aires is acually located further south than Cape Town in South Africa or Sydney in Australia. The southernmost provinces of Argentina are about 2000 km further south than Africa or Australia, in fact, and they are several hundred km south of southern New Zealand. A similar thing is true of Chile: Santiago is situated at roughly the same latutide as Buenos Aires is, and southern Chile extends about as far south as southern Argentina does.

537px-Antarctica_(orthographic_projection)

One of the effects of this is that the distance between Argentina and the other southernmost countries in the world, namely Australia, South Africa, especially New Zealand, can be a lot less than it appears. Looking at a two-dimensional map, for instance, one would probably assume that northern Argentina is a lot closer to South Africa than southern Argentina is. But in fact, southern Argentina is actually slightly closer to South Africa than northern Argentina is. Both are only around 7000 km from South Africa, which means that by sea Argentina is actually closer to South Africa than Argentina is to Venezuela or Colombia. Indeed, from southern Argentina to South Africa is more than twice as close by sea as is the distance between southern Argentina and Europe.

Similarly, even though New Zealand is often considered a part of Asia, the distance by air from Buenos Aires to central New Zealand is actually about the exact same as from central New Zealand to Shanghai, while the flight from southern Argentina to southern New Zealand is about 1.5 shorter than from New Zealand to Beijing. The flight from Melbourne or Sydney in Australia to Buenos Aires, meanwhile, is only about 1.5 times further than from Melbourne or Sydney to Shanghai, and is around the same as from Melbourne or Sydney to Mumbai. Sydney is around 9000 km from southern Argentina by air, whereas New York City is around 1600 km from Sydney by air.

Thus, anything that would reduce air cargo costs and the safety costs associated with flying over the Antarctic ice could be significant in increasing the interactivity between these Antarctic-region countries. In fact, the most direct route between Argentina and western Australia is by flying basically over the South Pole itself. Even by sea, however, by rounding the southern cape of South America, Buenos Aires is about as close to New Zealand as New Zealand is from Shanghai (and quite a bit closer than to Beijing or Seoul), and Buenos Aires is only about 1.5 times further from Australia as Australia is from Shanghai.

If Argentina becomes much closer than it is today to South Africa, Australia, and New Zealand – each a significant member of the global “Anglosphere” – it could perhaps help bring Argentina indirectly closer to the United States. In addition, and perhaps even more importantly, the US continues to have some very significant strategic military interests in various parts of the region around Antarctica: in particular, the US navy wants to ensure that it continues to have access to the route around the southern cape of Argentina and Chile, since its aircraft carriers are too large to pass through the Panama Canal or the Northwest Passage to move between the Pacific and Atlantic Oceans.

There are some other reasons to think that Argentina might become somewhat more closely entwined with these countries. In the case of South Africa, most of Argentina’s exports (which are mostly of food) pass directly by its shores on their way to food importing nations in the Arab world and southern Asia. In addition, South Africa’s chief regional rival is Angola, a Portuguese-speaking country that was often the world’s fastest growing economy during the past decade or so, and which has potential pan-Portuguese ties with Argentina’s potential rival, Brazil (and to a lesser extent with Mozambique, which is South Africa’s most populous next-door neighbour by far). It is not unthinkable that a South Africa-Argentina relationship would form to counter a Brazil-Angola one.

global trade

Argentina could also potentially become closer with South Africa and Australia if Argentina finally uses its wealth to develop a large industrial base, since South Africa and Australia are both huge exporter of various minerals. Or, if Argentina finally mends its relationship with Britain over the Falklands; during the Falklands war, for example, even then-apartheid-era South Africa cut off diplomatic ties with Argentina, and did not resume them for nearly a decade. Also, if Australia’s severe water shortage risks eventually turn it from a net exporter of grains to a major net importer of grains, it could lead to a much larger trade relationship between the two countries.

Finally, because of the relative proximity between areas of the Antarctic region, if the southern halves of Argentina and southern Chile could be developed economically on a significant scale for the first time, perhaps through the use of new technologies like water desalination (southern Argentina is arid), wind power (southern Argentina is one of the windiest places on the planet), machine-intensive development (southern Argentina lacks a significant labour force because it is sparsely populated, but it is also resource rich), or cheaper air travel (southern Argentina and Chile have huge tourist potential, yet are very remote, and in many cases are also highly mountainous and archipelagic), it might have a positive influence on their economic interaction with fellow Antarctic-region economies in South Africa, southern Australia, and New Zealand.

10. Political Convergences

Earlier we talked about how Argentina’s and the United States’ geo-economic and political systems are in a certain sense complete opposites of one another, with Argentina being highly centralized around northern Argentina in general and Buenos Aires in particular, and with the US being extraordinarily diffuse by comparison. However, this could be changing in both countries, because of technology. In the US, technology may be serving to bring the country’s disparate regions closer together – as communication has already become easy because of the Internet, and travel could perhaps become much easier in the future as well. Technology might allow the US to overcome its de-centralized geography to become somewhat more centralized, in other words.

In Argentina, conversely, technology could perhaps allow the country to overcome its centralized geography to become somewhat more de-centralized, if, for example, it empowers Argentinian individuals, businesses, or other groups, allows northern Argentina to become somewhat less dependent on Buenos Aires, or allows for the development of regions – such as the Andes regions and southern Argentina – that in the past have not had significant economies. If technology allows the US to become more centralized and Argentina less centralized, the two countries might start to have more in common in terms of political culture. In turn, this could perhaps help them finally become closer to one another.


Ramblings on regional Canadian Politics

(Disclaimer: this article is more or less a rambling thought-experiment, and should not be taken as a concrete prediction of Canada’s future)

The province of Ontario has long been the most dominant force in Canadian politics. Though it has never been powerful enough to simply impose its will on the rest of the country, neither has the rest of the country been powerful or united enough to sidestep its interests. Ontario’s strength rests on six pillars:

It has the largest economy, with an estimated 37% of Canada’s GDP, compared to just 19.5% for Quebec, 17% for Alberta, 12% for British Colombia, and 4% for Saskatchewan.

It has the largest population, 39% of the Canadian total. By contrast, Alberta, despite having 17% of Canadian GDP, only has 11% of Canada’s  population.

It has by far the largest commercial relationship with Quebec, nearly 8 times as large as any other province has.

It has the largest commercial relationship with Alberta, 1.5 times greater than BC’s relationship with Alberta.

It is tied with Alberta for having the largest commercial relationship with British Colombia.

It is the least dependent on inter-provincial trade: it conducts 2.5 times more trade with other countries than it does with other provinces, compared to just 1 – 1.5 times more for Quebec, Alberta, and British Colombia.

A number of these pillars could be undermined in the near future. First, Ontario’s economic size advantage could be cut into by either or both British Columbia and the three Prairie provinces (Alberta, Saskatchewan, and Manitoba). The Prairies will continue to grow if commodity prices continue to rise, since they depend heavily on exporting energy, food, and other natural resources like potash and iron ore. (Of course, the reverse is also true: if commodity prices drop, their economies might shrink relative to Ontario’s). Already the commodity price boom that began in 2002 has boosted the Prairies’ output from 19 to 24% of Canadian GDP, helping to push Ontario’s share down from 42% to 37%.

British Columbia, meanwhile, may outperform Ontario over time for a number of different reasons. For example, BC may benefit more than other provinces from continued economic growth in Asia. BC has the largest proportion of Asian inhabitants of any Canadian province: approximately 25% of BC’s population is of East Asian or South Asian origin, compared to around 17% of Ontario’s, 10% of Alberta’s, and just 3-6% of Quebec’s. An estimated 11% of BC’s population is of Chinese origin in particular, compared to just 5.5% of Ontario’s population, 4.5% of Alberta’s, and 1.3% of Quebec’s.

Much of BC’s Asian population is comprised of bilingual second-generation immigrants who, with a median age of roughly 15 years old, are only just on the cusp of participating in BC’s workforce. BC also has the shortest and cheapest time shipping back and forth between Asia, since, unlike in most other Canadian provinces, doing so does not require two roundabout trips through the far-away, busy Panama Canal. Asia’s economic growth has already helped BC to maintain its share of Canada’s GDP over the past decade, in contrast to Ontario which has seen its share of Canada’s GDP shrink.

Other factors also bode well for BC’s long-term growth prospects. British Colombia has long been the most physically isolated province in Canada, apart from Newfoundland. Not only is BC situated far away from Canada’s largest economies of Ontario and Quebec, but it is also far from those of the eastern half of the United States, where a large majority of Americans live. It is even far from Las Angeles and San Francisco. As such, British Columbia may benefit more than other parts of Canada from globalizing forces like the spread of digital technology and cheaper air travel or shipping, which help to overcome the limitations of physical distance.

112215-004-C862204F

To some extent this has already begun to occur. BC has booming film and video game production industries, for example, and regularly attracts tourists from as far away as Australia. BC may continue to benefit from this type of thing in the future, if and as globalization deepens. Given its unique combination of warm weather (by Canadian standards), beaches, mountains, and rare temperate-climate rain forests, the increased accessibility that may be provided by globalization could be a serious boon for the British Columbian economy.

BC has also been limited in the past by the relatively low – and falling of late – cost of natural gas and electricity in North America. BC accounts for more than 25 percent of Canada’s natural gas production (and Canada is the world’s 4th largest gas producer), and it also has a huge amount of shale gas and hydroelectric potential. However, because natural gas and electricity cannot cheaply be exported long distances, or across the Rocky Mountains, or by ship to other continents like oil and coal can, BC has not profited from energy resources to nearly the same extent as its super-rich neighbours in Alberta and Saskatchewan have.

BC had recently hoped to get in the LNG (liquified natural gas) exporting game, and is still likely to do so; however, the shale revolution that has provided US states like Texas with huge gains in natural gas production will probably make such exports far less profitable than they otherwise would have been. The US not only has a glut of natural gas right now, but also has a huge lead on the extremely expensive infrastructure required to liquify and export natural gas overseas, since it is much cheaper to convert LNG import terminals (which Texas and other US states already have a lot of, but which no Canadian province apart from New Brunswick has) into export terminals than it is to build LNG export terminals from scratch.

Over the longer term, however, BC may benefit from new labour-saving technologies that move global manufacturing back from countries that have cheap labour to those which have cheap energy and capital. If, in other words, industrial mechanization technologies reach the next level of sophistication, manufacturing could flood back into North America, causing the price of North American electricity and natural gas to rise. This would be very helpful to the BC economy, not only because BC has an abundance of energy, but also because its lack of non-mountainous land has limited the size of its population, which has caused its labour costs to be relatively high. BC hydroelectric and natural gas production (and wind power, which BC has an enormous potential for as well) could also benefit from any regional, continental, or global effort to safeguard the environment by reducing dirtier oil and coal consumption.

While the economies of BC and/or the Prairies grow faster than Ontario’s, Alberta and BC are also likely to begin trading much more with one another than they currently do. Today, most of the goods produced in Alberta are either consumed in Alberta or exported to Ontario or the United States. The emergence of Asia’s economies, however, may lead Alberta to send a greater share of its energy and food exports westward to the Pacific, via BC. Already Asia accounts for around 40% of the world’s imports of oil, 70% of the world’s imports of liquefied natural gas, and more than half of the world’s imports of food, even as its per capita gdp is still only around $6000. If Asia continues to grow, so too will Alberta’s reliance on British Columbian roads, railways, and ports.

The shale oil industry that emerged in the United States during the past few years might also lead Alberta to send more of its exports westward to BC. Producing shale oil releases enormous amounts of natural gas from the earth as a by-product, such that American natural gas production has risen by more than 25% since 2008. Unlike oil, natural gas cannot be shipped cheaply overseas; only 7% of the world’s natural gas is transported via ship, compared to more than 50% percent of the world’s oil. As a result, Americans have begun looking to export gas to Mexico and Canada by way of overland pipelines.

Mexico’s imports of natural gas from Texas, which already doubled between 2010 and 2013, are expected to double again during the next few years. Ontario (and perhaps Quebec), similarly, can expect to see big increases in imports from US states within the Marcellus shale basin, such as Pennsylvania and West Virginia. The Marcellus basin has seen by far the largest and most rapid increase in gas production in the United States of late; Pennsylvania alone has become the third largest American shale gas producer by raising its output by more than 300% since 2011.

The Utica basin, meanwhile, which is located in states like Ohio and Michigan, has seen enormous increases in gas production during the past year as well. This may continue, particularly if New York state ends its ban on natural gas fracking. And, crucially, pipeline infrastructure between Ontario and this part of the US is already in place, since in previous decades Ontario used to export Albertan gas to American states on its borders. There are ten gas pipelines linking Ontario to the US; by comparison, British Columbia and Quebec together only have five gas pipelines that connect to the US.

utica gas

us_shale_map

Just as Alberta finds its gas markets in Ontario and Quebec squeezed by closer-by production in eastern American states like Pennsylvania, it will also face a greater level of competition in US markets as a result of shale production in nearby states like North Dakota. Almost all of the Prairies’ exports of energy and food to American markets travel by way of pipelines or trains that pass through North Dakota. North Dakota has already increased its production of energy by more than 500% since 2007, so these trains and pipelines are now much more expensive to use. Indeed, due to a shortage of oil pipelines, the share of North Dakotan oil that is transported via train has risen from roughly 20% to 75% in the past six years, nearly overwhelming the state’s rail network.

Finally, the shale boom in the Gulf states of Texas and Louisiana, the first and third largest energy producers in the United States, combined with economic development in Mexico and the Caribbean, is making the use of Gulf of Mexico’s ports and refineries much more competitive than they have been in the past. This matters to Alberta, since much of Alberta’s oil was supposed to have been refined in the Gulf region. Now, however, many of the Gulf’s refineries might begin to be retrofitted to refine the ultra-light oil released from shale instead of heavier types that Alberta and Venezuela produce.

Alberta and the other Prairie provinces are also affected by this because their exports of food, coal, and some other resources are usually shipped to global markets via ports in the Gulf of Mexico (after being trained through North Dakota and then barged down the Mississippi River), such as the ports of New Orleans and Houston, both of which handle more cargo in terms of sheer tonnage than any other port in the United States. As a result, Alberta and Saskatchewan may soon have to rely more heavily on BC, where there will be far less competition from American shale energy, and where more export facilities will be built to transport fossil fuels, food, and other commodities to Asian markets.

Quebec too is likely to degrade its economic relationship with Ontario. Quebec has the most rapidly aging population of any major Canadian province, and so may soon face challenges in producing or consuming enough to keep its economy growing at a pace it is satisfied with. This challenge is compounded by Quebec’s feeling of cultural insecurity and lack of control over its borders, since not only is Quebec relatively wary of immigrants, but any immigrants it does bring in can always choose to go live in other parts of Canada that are wealthier, warmer, and more welcoming.

One of Quebec’s solutions to this problem will be to attract French-speaking immigrants from nearby Haiti and from northern and western Africa. In turn, these immigrants will create economic relationships between Quebec and their native countries. Indeed, with a large wave of second-generation immigrants in Quebec coming of age during the next decade, this process may soon begin to accelerate with or without further immigration. Already Quebec`s most common foreign languages are Arabic, Spanish, Italian, and Portuguese, in contrast to most of the rest of Canada where they are Punjabi, Cantonese, Mandarin, and Tagalog.

Quebec will also use the introduction of the internet in the developing world to interact much more with these countries, in areas like media, banking, and software development. The internet might also allow Quebec to engage increasingly with France, which is still the world’s fifth largest economy and has the youngest population of any large country in Europe. To get an idea of just how significant Quebec’s linguistic affinities might soon become, consider that even today Quebec`s largest foreign trade partner apart from the US and China is Algeria, an Arabic country in North Africa that is only so-so at speaking French.  Unlike other Canadian provinces, Quebec has chosen to import much of its oil from Algeria. This is particularly noteworthy given that oil is not even an industry in which speaking the same language would seem all that important. If Quebec can let such ties influence its oil purchases, imagine what its future might be in industries where language actually matters.

Quebec could perhaps also find that globalization will give it greater affinities with Romance economies like Latin America, Italy, Spain, Romania, and Angola. It is, after all, far easier for a  speaker of Spanish or Italian to learn to get by in French than it is for an English speaker to do so. Plus, Latin America speaks English less than almost every other part of the world, so there may be less competition there for French speakers than would otherwise be the case. As a result, Quebec’s commercial patterns are even more likely to diverge from those of Ontario. This is because Ontario’s focus in a globalizing world will probably be oriented more towards the places its immigrants are from, such as China, South Asia, and the Philippines, as well as towards English-speaking economies like the United States, Britain, Australia, Jamaica, Nigeria, South Africa, and Singapore.

Romance languages global map

Romance_Languages-World-Map

Finally, the Atlantic Maritime provinces of Nova Scotia, New Brunswick, Newfoundland and Labrador, and Prince Edward Island could become better integrated with one another than they are today, and better integrated with the economies of western Canada, Quebec, Europe, and the Northeastern United States than they are today.

Today the Maritimes are, to a certain extent, divided from one another by the ocean. Both Newfoundland and Prince Edward Island are islands (though PEI was connected to the rest of Canada by a 13-km long bridge in 1997), while Nova Scotia, the most populous Maritime province, is a peninsula with a large island, Cape Breton, on its northern edge. To drive, for example, from Halifax (the largest city in the Maritimes) or Yarmouth (on the southern tip of Nova Scotia) to Fredericton or Saint John in New Brunswick can be about 350 – 600 km, even though flying is only around 150 – 250 km. To drive from Halifax to Charlottetown on Prince Edward Island is 285 km, but only a 175 km flight. And St Johns on the island of Newfoundland is about a 900 km flight from Halifax or Fredericton. As a result, if short-distance airplane costs become cheaper, it could help the Maritime provinces to become better integrated with one another.

2000px-Atlantic_Canada

A similar thing is true of the Maritimes’ relationship with Quebec and with the Northeastern United States. Currently it is 550 km drive from Saint John, New Brunswick (a province where about a third of people speak French) to Quebec City and a 790 km drive from Saint John to Montreal. If, however, the American state of Maine builds an east-west highway, those numbers could drop to around 400 – 550 km. (This would also shorten the drive between the Maritimes to Toronto, Ontario, but that would still remain over 1000 km long). Meanwhile, cities like Halifax and Yarmouth are about 1000 – 1400 km away from  from Boston and New York City by road, but only 450 – 950 km from them via airplane.

Commercial ties between Quebec and the Maritimes could also deepen as a result of the development of areas in northern Quebec and Newfoundland’s mainland territory of Labrador, which share a land border with one another that is over 2000 km long (see map above). These areas have been too remote to populate in the past, but over time it is possible that they will become less remote, or that the development of their natural resource sectors – which have a great deal of potential – will be realized with fewer humans and more machines.

In recent years, the Maritimes have been becoming much better integrated with the Canadian Prairies, as large numbers of young people from the Maritimes have moved to oil-rich cities like Edmonton and Fort McMurray to find employment. This trend may continue in the future (though, if oil prices fall, it may also be reversed), and, if globalization deepens, so too might the general trend of the Maritimes being able to interact with faraway western Canadian provinces that in the past they have had relatively little to do with. It is, by the way, almost 5000 km from Halifax to Vancouver via land, and more than 11,000 km to ship goods between Halifax and Vancouver by way of the Panama Canal.

Finally, the economy of the Maritimes could become better integrated with Europe. The Maritimes tend to have closer ties of identity to Europe than other Canadian provinces do, and  they also have a decent-sized French-speaking population that might increasingly interact with France as a result of globalization. The Maritimes are, in fact, located closer to Europe than they are to the Canadian Prairies.

Perhaps most importantly, it is possible that the Maritimes will begin exporting significant quantities of natural resources – particularly oil from Newfoundland, but potentially also liquified natural gas from New Brunswick, as well as other commodities  – to European economies. Newfoundland today accounts for around 17 percent of Canadian oil production, most of which is exported to the US or other Canadian provinces. However, as the US and other Canadian provinces have increased their oil supply in recent years as a result of shale energy and the Albertan oil sands, Newfoundland has been looking further abroad for customers. Europe would seem like a natural fit; not only is it relatively nearby, but it is also increasingly in search of energy imports, given that its traditional energy suppliers in Russia and the Middle East have been consuming a growing share of their oil and gas instead of exporting it, and exporting a growing share of their oil and gas to India and Asia instead of to Europe.

The relationship between Newfoundland and Britain could become particularly interesting. In the past, Britain has not been an oil importing economy, but instead produced its own oil from the North Sea. In the past few years, however, British oil production in the North Sea has been dropping very quickly, forcing the British to become net oil importers for the first time in a long time. Britain still only imports a relatively small amount of oil, but if North Sea energy production continues to fall  (as many believe it will, not only in British waters, but also in Norwegian, Dutch, and Danish ones) Britain could quickly become one of the world’s largest oil importers. Especially given the historical ties between Britain and Newfoundland – as recently as 1948, 14 percent of Newfoundlanders voted to essentially continue being part of Britain, and 45 percent voted to be independent rather than join Canada –  this could potentially help create close economic ties between the two.

20140301_BRC434

To sum up, Ontario`s economy could be likely to shrink compared to BC and/or the Prairies and become relatively less integrated with Quebec and Alberta, at the same time as the economies of Alberta and BC become much better integrated with one another and the Atlantic Maritime economies become better integrated with Europe, with Quebec, with one another, and possibly with western Canada. As a result, it is not impossible to imagine that Ontario’s dominant position in Canadian politics could largely disappear, possibly even within a fairly short period of time.

If this were to occur, Canadian unity might be forced to rely much more heavily on sentiments of national identity than it does today. This could be problematic, as provincial economic interests (and environmental interests) may in many cases run counter to one another. It might force parts of the country to have to decide between economic development and national cohesion.

With potentially divergent economic interests, and with each individual major province already conducting an average of around 1.7 times more of its trade outside of Canada than with other provinces, and with the continued existence of Quebecois nationalism, Canadian political unity could become strained, perhaps to the point of provinces or regions becoming effectively or even formally independent. I am certainly not predicting that this will happen – I am a Canadian, so I know firsthand that Canada’s sense of national identity is relatively strong – but I would also not rule it out entirely, given the factors discussed above.

On the bright side, if the Canadian state really was ever to dissolve, it could make for some really interesting hockey tournaments at future Winter Olympics.

The Geopolitics of Ukraine

If you look at the population density map of Ukraine below, you can see that its inhabitants tend to live extremely close to the borders of the country. The largest city in western Ukraine, Lviv, is only 70 km from Poland. The central city of Kiev, which has twice the population of any other Ukrainian city, is just 85 km from Belarus. The largest city in eastern Ukraine, Kharkiv, is 60 km of Russia. And the largest city in the south, Odessa, is just 40 km from Moldova and directly borders the Black Sea.

Of the 18 largest cities in Ukraine, only three –  Dnieproprovosk, Krivvy Rihy,and Zaporihziya – are located more than 100 km from any of the country’s borders. This is pretty remarkable considering that Ukraine spans 1200 km from east to west and 800 km from north to south, encompassing a territory larger than that of any European country apart from France, Russia, or Turkey. It is indicative of the country’s deep internal divisions. Indeed, as has been pointed out often of late, the name Ukraine literally means borderland.

population_density

From a geographical perspective, Ukraine can be roughly divided into four regions: a plateau in the west, hills and valleys in the east, the Dnieper River Valley in the centre, and the Black Sea coastal plain in the south (see map below). Ukraine’s cultural, religious, and economic divisions generally reflect these geographical ones. In eastern and southern Ukraine, for instance, as many as 85% of people speak Russian, which is arguably around twice as much as in the centre of the country and 20 times as much as in some parts of the west of the country.

Roughly forty percent of Ukraine’s practising Christians are affiliated with the Kiev Patriarchy of Orthodox Christianity, while thirty percent (mostly in the east) are affiliated with the Moscow Patriarchy and fifteen percent (mostly in the west) with Catholicism. Southeastern Ukraine produces virtually all of the country’s coal, which is significant given that Ukraine is the 11th largest producer of coal in the world, and coal generates about a third of all energy used worldwide.

Ukraine_topo_en

Official_Russian_language_support_in_Ukraine

With such divisions, it is no surprise that the country has a difficult time achieving political stability. The departure of President Yanukovych this week marks the third time since 2004 that a President has failed to complete his or her term.

From a purely economic perspective, Ukraine is tied together by its dependence on Russia. Even though the eastern half of Ukraine is far more integrated with Russia than western half of Ukraine, the country as a whole receives 36% of its imports from Russia, compared to just 9% for its next largest import source, Germany. It sends 27% of its exports to Russia, compared to just 6% to its next largest export destination, Turkey. Ukraine conducts a further 4.5% of its trade with Belarus and 3% of its trade with Kazakhstan, both of which remain deeply integrated with Russia themselves. Ukraine also maintains important financial relations with Russia in a variety of other ways, for example through remittances from the large number of Ukrainians living in Russia and in Kazakhstan.

Of course, Ukraine and Russia also share a long history. Kiev is actually thought to have been the birthplace of the Russian nation, during the tenth century AD. Ukraine was then a part of the Russian empire for close to four centuries prior to the collapse of the Soviet Union only 23 years ago. Even today, the Russian and Ukrainian languages share partial mutual intelligibility to a much greater extent than Ukrainian does with other Slavic languages, like Polish or Bulgarian. Many or most Russians still consider Ukraine to be an integral part of their country’s sphere of influence, or even a part of Russia itself.

Russia Cares

Ukraine has the sixth largest population in Europe (not including Russia, Turkey, or Egypt), and the largest territory. Thus, if Ukraine were to be controlled by Russia, Russia would be much closer to being the Great Power that it used to be– something that is probably appealing to many Russians. However, even apart from Russian nostalgia and nationalism there are a number of important reasons for Russia to care deeply about Ukraine.

Ukraine is the world’s 11th largest producer of coal, 6th largest of iron ore, 5th largest of corn, 4th of barley, 5th of rye,  and 9th largest of both wheat and soybeans. It is also the 10th largest exporter of weapons. Russia, meanwhile, is the world’s 6th largest producer of coal, 5th largest of iron ore, 1st of both barley and rye, 4th  of wheat, 10th of soybeans, 11th of corn, and 2nd or 3rd of weapons. Thus, Russia and Ukraine are in many ways direct economic competitors of one another. Russia might therefore benefit from being able to exert influence over Ukraine, in the same way that a business would benefit from exerting influence over a major competitor of theirs. In addition, approximately 80 percent of Russian gas and oil exports to Europe are shipped via pipelines that traverse Ukraine, and the Russian economy remains extremely dependent upon these exports.

The Russians also view Ukraine as an essential component of their geopolitical security. Eastern Ukraine is located only 440 km from Kazakhstan, and Russia relies on this relatively narrow corridor between Ukraine and Khazakstan in order to access its entire southern region in between the Black and Caspian Seas – an area roughly the size of France, which is a critical part of the Russian economy because it is warmer than any other part of Russia, has a very long coastline, and is where the Volga-Don river network flows into the Black Sea. The Volga-Don river system is where nine of Russia`s sixteen largest cities are located, including Moscow, and the rivers are themselves used to transport a significant portion of Russian industrial and agricultural goods to domestic and international markets.

bigMap

Given recent events, the strategic location of the Crimean Peninsula should in particular be understood. As can be seen from the map above, Crimea has the potential to block the movement of Russian ships out of the Azov Sea, the part of the Black Sea that both the Volga-Don network and the Black Sea-Caspian Sea canal empty into.  Moreover, Russia’s Black Sea coastline to the south of Crimea is lined with mountains (see map below), potentially making it difficult for Russia to access any other part of the Black Sea if Crimea were to ever be held against it, as historically nations like the Turks, British, and  Germans have done.

Finally, possession of Crimea might allow Russia to to influence southern Ukrainian cities which have relatively large Russian populations, most notably the southwestern city of Odessa. Odessa is Ukraine’s fourth largest city, by far the largest port in Ukraine, and has a population that is perhaps one-fifth “ethnic Russian”. Odessa is also only 170 km from Crimea, and is just 40 km away from Transnistria, a Russian-supported and partially Russian-inhabited secessionist province of the Romanian-speaking country of Moldova.

black-sea-map

The Black Sea is very important to European countries. The region surrounding the sea, comprising Ukraine, Moldova, southern Russia, Turkey, Georgia, Romania, and Bulgaria, have a combined population of over 200 million, a population that includes much of the most cheaply employable labour in Europe. The Black sea basin stretches inland as far as Germany (see map above). The Black Sea also connects to the Mediterranean, and by extension to the Atlantic and Indian Oceans. Finally, for countries that do not want to rely too heavily on Russia or Iran, the Black Sea is the only economic route from Europe to the vast, resource-rich region of Central Asia (via Georgia, Azerbaijan, and the Caspian; see map below).

Ukraine has a width of 700-1300 km and borders both the Black Sea and the Carpathian Mountains. As a result, when Ukraine, Belarus, Moldova, and the Baltics are all a part of Russia’s sphere of influence, as to varying degrees they all are today, Russia’s effective land border within Europe becomes about 12 percent shorter than its official border, its non-mountainous land border within Europe becomes about 40 percent shorter and divides into two separate parts, and the limits of its influence reach more than twice as far to the west of Moscow as they otherwise would. If Russia believes that it needs this strategic depth, shorter land border, and mountainous buffer, it will see Ukraine as being indispensable to its national security.

Europe_topography_map_en

And remember, Russia is an extremely suspicious country. It is a country that has been invaded many times, that had 20-30 million of its Soviet citizens killed during WW2 (compared to less than 2 million casualties for the United States, Britain, France, and Italy combined, and less than 11 million for Germany and Japan combined*), and that was traumatized during the 1990’s when its post-Soviet economy and political system was in a state of chaos and decline prior to the ascendency of Putin in 2000 and the rapid rise of natural resource prices that began in 2003. Russia is currently very worried about the possible military emergence of countries like China, Japan, Turkey, Iran, Pakistan, and India to its east and south, in addition to its usual concerns over the long-term intentions of European countries, militancy and separatism in its Caucuses Mountains territories like Chechnya and Dagestan, and instability in Afghanistan spilling over into parts of Central Asia.

*(WW2 casualty numbers vary pretty widely depending on which sources you look at, and, where the Soviet Union is concerned, it can also be difficult to determine what share of the casualties were “ethnic Russians”) 

Ukraine’s Future

There has been a lot of talk about the possibility of dividing Ukraine into two countries. While this is not totally inconceivable, it does beg a number of questions, such as whether the Russians are prepared to live with a Western Ukraine that is formally integrated into Europe, and whether Kiev and the other central Ukrainian cities would be drawn toward Eastern Ukraine or Western Ukraine.

Regardless of what happens to it in the immediate future, Ukraine continue to evolve over time as a result of economic developments at home and in the countries around it. From an economic standpoint, Ukraine not only has significant natural resource and agricultural potential, but also some of the most cheaply employable labour anywhere in the vicinity of Europe. Ukraine has a per capita income that is only 27% as high as Russia’s, 36% as high as Turkey’s, 49% as high as Romania’s, 56% as high as Bulgaria’s, and 57% as high as Belarus’s. The only nearby countries poorer than Ukraine are Morocco, Egypt, Syria, Palestine, Georgia, and Moldova, which together have a per capita income around 80% as high as Ukraine’s. With the exception of Egypt, Ukraine has a much larger population than any of these countries.

GDP per capita European Periphery

Finally, Ukraine enjoys easy access to the sea itself, not only because of its ports along the Black Sea, which unlike most of Russia’s do not freeze in the winter, but also because of its numerous navigable rivers. Three of Europe’s four longest rivers run through Ukraine. One of these rivers, the Dnieper, is also one of the two widest rivers in Europe, and deep, and as such allows large ships – up to 270 meters long by 18 meters wide, approximately – to travel all the way inland to Kiev and the border with Belarus. In the future, moreover, a canal linking the Dnieper to Belarus’ Bug river could become usable if Belarus gives the go-ahead for a relatively small amount of construction work on a new lock system. According to Wikipedia, this might allow ships of up to around 110 meters by 12 meters to go all the way from the Black Sea to the Baltic Sea and Atlantic Ocean.

For all of these reasons, Ukraine`s economic growth potential could be enormous. Ukraine’s economic progress has, however, typically been hampered by Russian domination. Russia generally lacks the navigable rivers, long coastlines that don’t freeze in the winter, and proximity to Europe that Ukraine possesses. Russia has historically also posed a military threat to Europe, which has often led Europe (and the United States) to shun Russia economically, hampering Russia’s development.  Russia’s absorption of Ukraine hurt Ukraine’s economic growth, therefore. Indeed, Russia’s per capita income is only so much higher than Ukraine’s today because of the incredible rise of oil and gas prices over the past decade, and because of Ukrainian political dysfunction.

During much of the twentieth century energy prices were not nearly so high, even adjusting for inflation.  Russia was very poor, therefore, and kept Ukraine poor with it in a number of ways, ranging from the infamous forced collectivization of Ukrainian farms under Stalin, to the fact that Ukraine’s railway network still cannot connect directly to Europe’s because railroads throughout the Soviet Union were constructed to use a different gauge than European ones used.  The question of Russia’s influence in Ukraine could therefore determine not only Ukraine’s political future, but also its economic future. This is obviously a big part of the reason that many Ukrainians would rather their country be closer to Europe than to Russia.

If we assume for a moment that natural resource prices will not continue to rise rapidly as they have in the past decade, and that future economic growth will depend instead upon other factors such as demographic trends, labour costs, and the accessibility of external trade and investment, then we can guess that Ukrainian neighbours like Turkey and Romania will  outgrow the Russian economy in the years ahead, while Germany and Western European countries will probably grow slower than Russia will.

How might such changes affect Ukraine? One way to get a very rough idea of this is to think about which countries trade the most with Ukraine as a percentage of their gdp. A country like Moldova, for example, may only account for only 1% of Ukraine’s trade today, but it also has one of the smallest economies in the world, so that relative to the size of its gdp it probably trades more with Ukraine than any other country does. As a result, if Moldova’s income were to become significantly larger than it is today, Ukraine’s economic relationships could be affected to a meaningful degree.

By contrast, Germany may be Ukraine’s fourth largest trade partner today, but it is also the world’s fourth largest economy, so as a share of its gdp its trade with Ukraine ranks fairly low – more than 50 times lower than Moldova, in fact. Further economic growth in Germany might not affect Ukraine as much as growth in a number of other countries would, in other words. The following is a chart of Ukraine’s biggest trade partners that shows approximately how much they trade with Ukraine as a share of their gdp (in comparative terms only: ignore the numbers on the left-hand side of the graph, they are incorrect in absolute terms):

uktr

If we take this line of thinking a step further and imagine that in future decades every country will have the same per capita income as one another (in other words, that developing countries will all catch up to developed countries over time), and that all will continue to trade with Ukraine the exact same amount relative to the size of their gdp as they do today, then we can make a rough prediction as to what Ukraine’s trade patterns will look like in the future. This is, of course, just a thought experiment, not to be taken very seriously. That being said, it may prove useful in giving us a tiny glimpse of what Ukraine’s future could look like.

uktr

(the graph above shows countries’ trade with Ukraine only in comparative terms, not absolute terms. For all countries, absolute trade values with Ukraine are arguably more likely to grow than to shrink over time). 

This scenario would see Russia, the West, and China lose much of their commerical grip on Ukraine to Belarus and Moldova. Russia, however, would remain a major trade partner of Ukraine in spite of this decrease, as, to a lesser extent, would the the easternmost countries of both the European Union and the Mediterranean.

This raises a number of questions. First, to what extent will Belarus remain under the influence of Russia in the future? Second, given that Moldova could conceivably become a province of its large European neighbour Romania because of Moldova’s tiny size and the fact that Romanian and Moldovan are the same language, what role will Romania seek to play with regard to Ukraine?

Finally, given that most of Ukraine’s trade with the Middle East and Asia will probably continue to pass through the Turkish Straits in order to reach the Mediterranean and Indian Ocean, and that southern Ukraine was controlled by the Turkish Ottoman Empire from the 1450’s until the 1780’s, and that there are still about a quarter of a million Turkic (related to Turkish) Muslim people living in the Crimean Peninsula, plus an estimated 50-75 million other Turkic Muslim peoples living in Russia or in areas within Russia’s political sphere of influence, what role will Turkey seek to play with regard to Ukraine?

Of course, it would not be a surprise to anybody if Turkey, Romania, or Belarus never match Russia’s influence in Ukraine. Still, this thought experiment arguably helps to show that Russia’s influence in Ukraine might eventually be challenged, and that the challengers might not be the countries most people would expect, such as the United States or Germany. This is useful to keep in mind, as Ukraine’s size, location, natural resources, and internal divisions may continue to make it a conflict zone in Europe during the decades ahead.

8 Reasons Canadian Home Prices Might Fall

Canadian home prices have risen by more than 35% since 2006, while American home prices have declined by more than 10%.  This has been great for Canadian homeowners and for investors in the Canadian real estate market. It has, however, also terrified many Canadians, causing them to wonder whether it is only a matter of time until Canadian home prices fall just like those in the United States. They are right to be worried: there are a number of reasons to think that home prices in Canada’s major cities could fall sharply during the decade ahead.

1. Demographics

Today the typical Canadian is between 50 and 57 years old. In the next decade many will retire, and so will no longer need to base their housing decisions on job considerations. Many will want money to do things like travel, go out to restaurants more often, escape a month or two of the Canadian winter, buy or renovate a family cottage, save up for their approaching old age, pay for care for their elderly parents, and help their grown-up children to establish themselves financially.

At the same time, there is a large drop-off in the Canadian population below the age of 15. This means that the next ten years will see Canada’s youngest large age cohort – currently aged 15 to 20 – go from living with their parents to renting out a room or apartment on their own or living abroad. As a result, the typical Canadian will have an empty nest for the first time in the coming decade. They may therefore be tempted to downsize their homes in order to gain access to cash. This could be particularly true of divorced parents – and approximately 40% percent of Canadian marriages end in divorce – some of whom might have only kept a house in the first place because of their kids. Meanwhile, most 20 year olds living on their own for the first time will not be buying a home: the average age of buying a first residence in Canada is currently 29 years old, and is unlikely to decrease over the next decade because of the high youth unemployment levels that have existed since the recession of 2008.

Certainly Canadians will not need large houses to host family dinners: the Baby Boomers are expected to have only around three grandchildren on average, compared to four or five grandchildren for the generation that preceded them and six grandchildren for the generation their parents were a part of. An entire three-generation family – which by 2020 will typically be made up of two grandparents, one or two children, one or two children-in-law, and three grandchildren, for an average of just 5 adults and 3 youths – will in most cases fit comfortably around a single dinner table. This will make many Baby Boomers less hesitant to downsize their house in order to play host for the whole family.

Unless elderly Canadians begin to hold on to their homes for far longer than they ever have in the past (which, admittedly, could happen), demographic trends do not seem to be working in favour of the Canadian housing market. This is in sharp contrast to the United States, which has a significantly younger population.

2. The United States

When Canadians leave Canada, it is overwhelmingly to go to the United States. Approximately one million Canadians now live in the US, compared to just 70,000 Canadians living in Britain. There is a similar number of Americans who live in Canada, making the American population in Canada larger (not to mention wealthier) than any other national minority group. With the American economy having outgrown the Canadian economy by a significant amount during the past four years (after having grown quite a bit slower than Canada between 2007 and 2012), and with American housing prices having become much cheaper relative to Canadian ones than they were prior to the financial crisis of 2007, the United States could have a negative effect on Canadian real estate prices over the long term, if more Canadians are willing and able to move south and if fewer Americans are tempted to move north.

3. China

China has accounted for more than 20% of the world’s official economic growth since 2003. Over the next few years, however, it seems that China’s growth rate is likely to slow down, for a number of reasons including that the Chinese workforce is now much older and more expensive to employ than the workforces of most other countries in Asia. As it turns out, a Chinese slowdown could have a significant impact on Canadian real estate prices.

Canadian cities have been among the favorite places for Chinese to invest in, which is not such a surprise given that Canada has the world’s third largest Chinese population of any developed economy, behind only Singapore and the United States and close to double that of the next largest, Australia. The United States’ Chinese population is actually only around 2.5 times larger than Canada’s is, even as the total US population is almost ten times that of Canada’s total population. Of Chinese university students studying abroad, meanwhile, an estimated 12% are in Canada, trailing only the US (32%), Britain (17%), and Australia (13%), and far ahead of fourth-place Singapore (4%). China also finds investing in Canada useful because of Canadian natural resources: overall Chinese investment in Canada between 2005 and 2012 was roughly $35 billion, trailing only the US and Australia (both around $50 billion) and $10 billion more than the next largest, Brazil. As a result, a Chinese slowdown would arguably damage the Canadian real estate market.

4. Energy

Because China’s economy is based primarily around manufacturing and construction, its rise in the past decade helped to cause the biggest boom in commodity prices since the Second World War. The prices of electricity, oil, and natural gas soared. This has helped to keep housing prices high inside cities, since suburban sprawl is dependent on cheap gasoline for commuting, driving, shipping goods, plowing roads, mowing lawns and parks and golf courses, and moving around machines used in road maintenance and the construction of houses and roads — and it is  dependent on cheap electricity to light and air condition large suburban homes, cars, malls, and superstores, and on natural gas to heat them.

In Canada, higher energy prices also mean higher export revenues, which in turn means a stronger economy in general. To a much lesser extent, a similar thing is true of the cost of wood, which is also an input cost of the housing market as well as a significant Canadian export.

There is, not surprisingly, a strong historical correlation between oil and Canadian  real estate prices.  When oil prices reached their  modern-day lows during the mid-1990’s, Canadian home prices declined by roughly 5% in spite of rapid growth occurring in the general economy at the time. When oil prices reached their modern-day highs between 1979 – 1983 and 2008 – 2013, on the other hand, Canadian home prices went up by roughly 10% and 35%, respectively, even though the country’s two worst postwar recessions took place during 1982 and 2009.

Today, many people expect North American energy prices to fall, or at the very least not to rise rapidly in the way they did between 2003 and 2007. Looking at the futures market (financial markets in which people bet on what the price of something will be at some designated future time) you can see that the expectation is that the price of oil – from which nearly all gasoline is derived – will decline from around $105 a barrel today to $92 by April 2015, $84 by April 2016, $80 by April 2017, and $77 by April 2018 (Update: crude oil prices have dropped to $45 a barrel during January of 2015.) Natural gas prices in North America are not expected to rise during the next five years either. If the markets are correct about these prices, North American energy will become cheaper in the near future.

In addition to its affects on suburban development, cheaper energy also means cheaper airplane travel. For Canadians, this could make buying a place in a warm climate outside of the country more appealing. It could also let the Canadian population disperse itself more widely throughout its vast territories during the spring, summer, and fall. Most Canadian environments are not easily accessible by road, whether because of their ruggedness (particularly the Rocky Mountains, which cover almost all of British Colombia and parts of Alberta), or the fact that they are covered by incredibly dense clusters of rocks, lakes, and forests (particularly the Canadian Shield, which covers more than half of Canadian territory). Cheaper air travel could perhaps help to open up some of these enormous territories to development, which could hurt land prices within major Canadian cities, at least relative to those of smaller Canadian cities and the Canadian countryside.

5.          The Internet

The recent and ongoing spread of high-end smartphones and tablets in the developed world and of low-end smartphones, computers, and internet access in the developing world, and the fact that many of even the least tech-savvy Baby Boomers are now getting into the internet in a big way, means that at this very moment we may be smack-dab in the middle of the Internet Revolution, one of the defining events of our time. And it seems possible that, as cyberspace increases, real space – including real estate – could become less precious.  So, what effects might the Internet Revolution have on home prices in Canadian cities?

E-commerce, which has already increased massively in recent years, probably is not even close to as ubiquitous as it will become in the years ahead. The Internet and computer software have the potential to assist or replace a huge range of businesses. Books, e-books, furniture, household supplies, clothing, computers, bank withdrawals, and even groceries and pharmaceuticals can and increasingly are being ordered online. Coffee shops have already practically morphed into office spaces.

Changes such as these can allow people to work and shop from homes, offices, shared working spaces, or warehouses in places outside of the downtown core of major cities, or even outside of cities altogether. In turn, this may allow for some prime commercial real estate – for example, a skyscraper with thousands of offices in it, or an Ikea or Walmart with a large parking lot – to be converted into residential properties. To give just one example of this, it was announced last month that the US Bank Tower in Los Angeles, the largest American skyscraper west of Chicago, will soon be converted into a residential property because it failed to fill more than half of its office space in recent years.

Computer technology offers the possibility of outsourcing huge numbers of jobs that in the past could not have been outsourced. Not only do computers allow for  interaction between rich and poor countries, they also allow people living in the developing world to receive an education more cheaply and easily. Computers may also help lead many jobs to become automated by software or machines. More outsourcing and automation could reduce Canada’s appetite for immigration, which, because most immigrants come to Canada in their late 20’s or 30’s, would mean there would be fewer adults around  to rent or purchase homes.

The Internet also allows people to live in suburbia, cottages, winter homes outside of the country, or small cities or towns more easily. This is because it can help people to work or study online, and because it can help people deal with the stuck-in-the-middle-of-nowhere feeling that has often made people feel cooped up or unsafe living in the countryside. It also makes it easier for people living in suburbia, towns, or rural areas to get from one place to another more easily and cheaply, by allowing people to do things like:

-create far more flexible, reliable, and efficient “smart” transportation systems, whether public or private

– use their computer devices to see exactly when buses or trains are coming

– see precisely what traffic and road construction is like on any given route

-have goods delivered quickly and directly to their house after having bought them over the internet

-coordinate snow plowing and de-icing in rural areas during the winter, so that areas far off the beaten track can be accessible by car or truck rather than by snowmobile on certain days

– access emergency health care, both via webcam and by making it easier for rapid response teams to find the house they are going to if they have to find their way in the dark

-find friends or strangers nearby that are looking to go to the same place as they are so that they can carpool or share a taxi with them. (Update: Uber now exists). 

-get work done or, read, or watch a video when using public transportation or carpooling

-use an app that automatically allows them to split gasoline costs or cab fare when they are carpooling or sharing a cab with other people

-avoid getting lost or stuck in bad weather when driving through the dark countryside at night

-look online to find homes or apartments to rent

-work from home during part of the day or part of the week in order to avoid commuting during rush hour or when the weather makes road conditions poor

For those who doubt how impactful changes such as these could be, I would keep in mind three things. First, that the “smartphone revolution” is still incredibly new; its potential to affect things like transportation and health care has barely been felt so far, but probably will before long. Second, even now, imagine how much easier it would be to live in the countryside than it would have been in, say, 1975 or 1995, before these technological revolutions took place. And third, consider how little of Canada’s territory is accessible by road at the moment. Canada only has around 15-20 thousand km of highways, in a country that occupies nearly ten million square km. There is still a ton of room to spread out in, in other words. This is true even in the southern areas of the country; for example, the population density of the southernmost 15% of Ontario’s territory (see map below), an area including both Toronto and Ottawa, is approximately 80 people per square km, roughly a third of that of Germany or Britain.

IR_F3_SatelliteImage_noBorder_091217 F

(Ottawa is not displayed on this map; the two main urban areas it shows are Toronto and Buffalo. Note, however, how small even the sprawling Greater Toronto Area is in comparison to the relatively small portion of Ontario’s territory shown in this picture)  

6. Cottages, Condos, and Capital Gains

Not only does Canada have a ton of land,  it is also home to more lakes than the rest of the world combined. A large number of these lakes, including all of the Great Lakes, are located within a manageable drive of Canada’s largest cities. This has given the country an enormous cottage industry. Cottage ownership is, in fact, the Canadian Dream.

Most Canadians still do not own a cottage, however. But many more soon might, as a result of several of the factors already mentioned above. Canada’s demographic trends support the cottage industry’s growth, for example, as people often buy cottages relatively late in life in anticipation of future grandchildren and to relax when they scale back their work hours prior to their retirement.

Being able to get work and other things done over the Internet could also boost cottage ownership, as could cheaper gasoline, less traffic, better public transport within cottage country, and the ability to use the Internet to more easily rent or share waterski, fishing, or sail boats, which many cottage owners cannot easily afford to buy, dock, maintain, and store during the winter. The Internet is also increasingly allowing cottage owners in Ontario and Quebec to earn income by using sites like Airbnb to rent out their cottages to Americans – who, since the recent fall in energy prices, also have a more powerful dollar to rent them with – since the northern US lacks the dense cluster of lakes that are found in the Canadian Shield.

This is significant, because Canadian tax law gives cottage owners less of an incentive to own an expensive city home. The Canadian government allows people to designate one of their properties as a “principle residence”, which lets them avoid declaring capital gains on their income taxes when the value of that home increases. This often saves people a huge amount of money.

Canadians who own cottages have the option of designating their cottage as their principle residence instead of their city home, however. In the past, this has not mattered much, since home prices have been rising so consistently that the capital gains on a home always far exceeded those on a cottage. Yet, if in the future cottage values begin to increase faster than city home values, Canadians with cottages that are relatively expensive could begin to save more from designating their cottage as their principle residence. In other words, Canadians who buy cottages – or renovate or winterize cottages they already own – will have less of a tax incentive to own a large city home. The same is true of winter vacation condos Canadians own in places like Florida. As such, many Canadians may become more inclined to downsize their city home, or to sell their city home and start renting out a home or apartment in the city instead.

7.    Conventional Real Estate Indicators

Most articles you will find discussing real estate prices will not look at many of the things we’ve discussed so far. Conventional economic analyses tend instead to focus on factors that are more technical and that impact the market in less roundabout ways than, for example, the way in which smartphone apps could alter home prices by reducing highway traffic.

Conventional real estate indicators include the ratio between a country’s average income and the price of its homes, the ratio between the price of homes and the cost of renting similar homes, the the yield curve of bonds (which indicate what the market predicts future interest rates will be, the idea being that lower interest rates facilitate higher home prices by making it easier to borrow money to buy a home or pay off a mortgage) and the ratio between household debt and income (since it is presumably more difficult for an indebted person to take out or pay off a mortgage).

It turns out,however, that there is little hope for Canadian homeowners to be found in these conventional indicators either. Canadian home prices are 8 times higher than Canadian incomes, a ratio greater than that of any developed economies apart from France or Belgium. Renting a home in a major Canadian city is an estimated 30 – 40 times cheaper than buying a similar home, a ratio greater than that of any developed economy apart from Norway. The ratio between Canadian incomes and household debt levels is higher than it has ever been in modern times; it is nearly one and a half times higher than it was as recently as 2001, one and a quarter times higher than it was in 2005, and higher than that of all but seven other developed economies.

Finally, the yield curve on Canadian government bonds suggests that the market expects Canadian interest rates to become one and a half times higher than they are today by the middle of 2016, and twice as high as they are today by the middle of 2017. This is a relatively sharp increase, considering that the same yield curve shows rates becoming just three and a half times as high as they are today between 2017 and 2044. Moreover, the yield curve does not have perfect foresight: interest rates will probably rise prior to 2016 if the economy grows faster than expected in 2014 and 2015. (Of course, the inverse is true as well: interest rates may be held lower for longer if the economy underperforms expectations).

8. Construction Costs 

Historically, apartment buildings and houses have been very expensive and time-consuming to build, even ignoring the cost of building materials. But this could change. Indeed, we may even see house-building robots before too long, capable of working 24-7, 365 days a year. (Oh, and check this out). Certainly we should be not surprised if construction labour costs decline going forward, as labour costs in general are being squeezed by both automation and outsourcing. In that case, why even take the chance? Unless you really need to, you might want to think twice about putting all of your money into urban real estate.